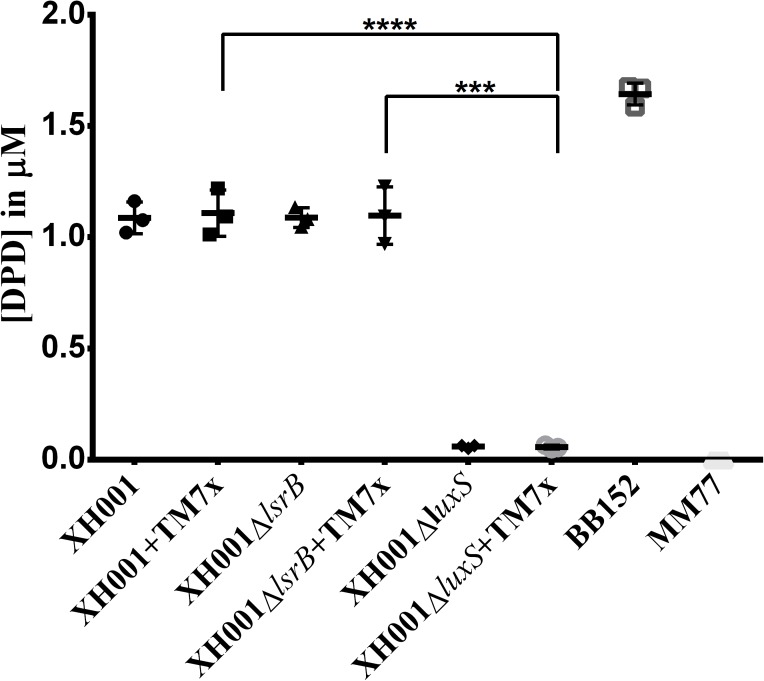
FIGURE 4.
Quantification of the AI-2 signaling molecule via GC-MS. DPD concentration in media was evaluated. Each bar represents the average of one independent culture performed in triplicate (error bars, SD). Significance is indicated when p = 0.0002 with three asterisks and when p < 0.0001 with four asterisks.

