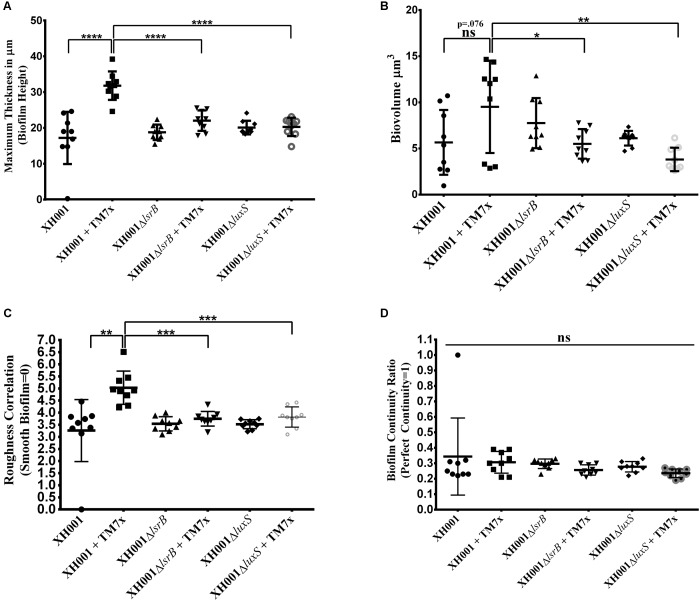
FIGURE 6.
Quantification of total maximal biofilm thickness (height), biovolume, biofilm roughness correlation and biofilm continuity ratio. Histograms represents (A) Maximum Biofilm Thickness (Height), (B) Biovolume, (C) Biofilm Roughness Correlation, and (D) Biofilm Continuity Ratio, comparing wild type XH001, XH001ΔlsrB, and XH001ΔluxS monoculture as well as co-culture when they were associated with TM7x. The images analyzed were acquired with the same settings as indicated in this figure and in section “Materials and Methods”. Three independent cultures for each group were selected with 3 representative images between each culture. Each bar represents the average of two independent cultures performed in triplicate (error bars, SD). Significance is indicated when p < 0.05, p < 0.01, p < 0.001, and p < 0.0001 with one, two, three, and four asterisks, respectively. Statistical analysis was performed using the Student t-test (two tailed) and one-way ANOVA analysis using Graph Pad Prism 6 software.

