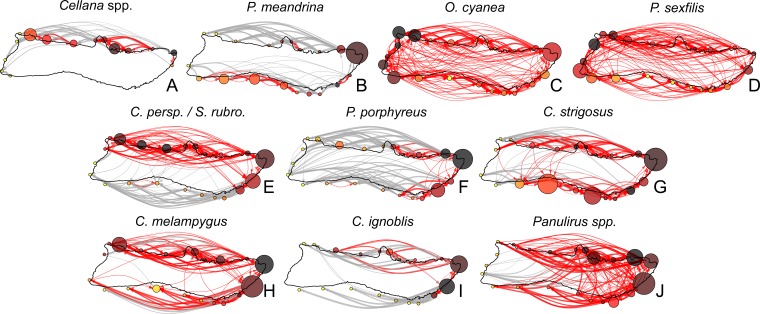
Figure 7. Moloka’i connectivity networks by species.
Graph-theoretic networks between regions around Moloka’i by species arranged in order of minimum pelagic larval duration. (A–D) Short dispersers (3–25 days), (E–G) medium dispersers (30–50 days), and (H–J) long dispersers (140–270 days). Node size reflects betweenness centrality of each region, scaled per species for visibility. Node color reflects out-degree of each region; yellow nodes have a low out-degree, red nodes have a medium out-degree, and black nodes have a high out-degree. Red edges are connections in a strongly connected component, while gray edges are not part of a strongly connected component (although may still represent substantial connections). Edge thickness represents log-transformed proportion of dispersal along that edge.

