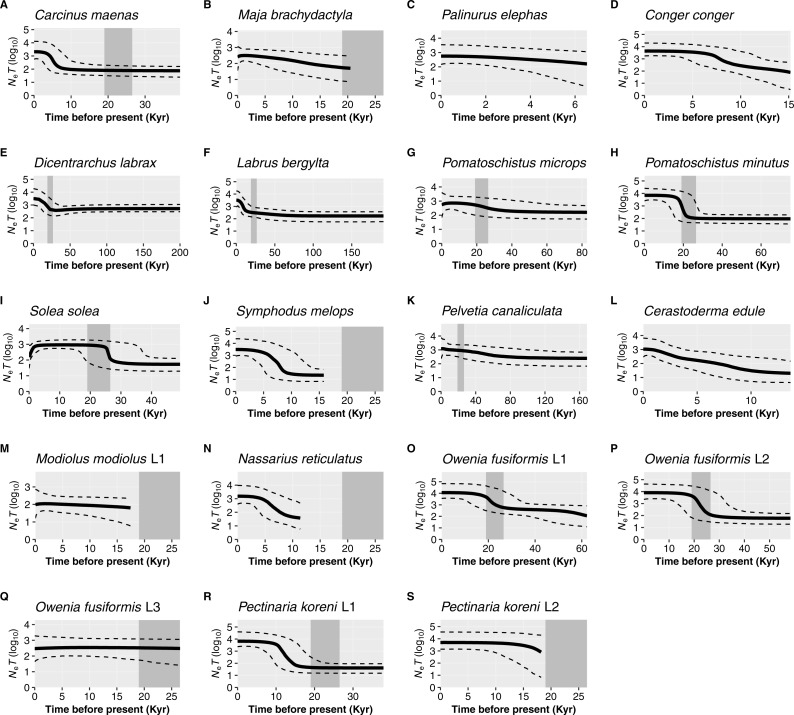
Figure 5. Bayesian Skyline Plots for species or lineages (L) in which the demographic expansion hypothesis was not rejected.
Solid black lines show the medium effective population size over time (Ne = effective population size and T = generation time); dashed black lines represent the 95% confidence intervals. The estimated time-frame of the Last Glacial Maximum is denoted by the area shaded dark grey. Species are organised by taxa: crustaceans, Carcinus maenas (A), Maja brachydactyla (B), Palinurus elephas (C); fish, Conger conger (D), Dicentrarchus labrax (E), Labrus bergylta (F), Pomatoschistus microps (G), P. minutus (H), Solea solea (I), Symphodus melops (J); macroalgae, Pelvetia canaliculata (K); molluscs, Cerastoderma edule (L), Modiolus modiolus Lineage 1 (M), Nassarius reticulatus (N); polychaetes, Owenia fusiformis Lineage 1 (O), O. fusiformis Lineage 2 (P), O. fusiformis Lineage 3 (Q), Pectinaria koreni Lineage 1 (R), P. koreni Lineage 2 (S).

