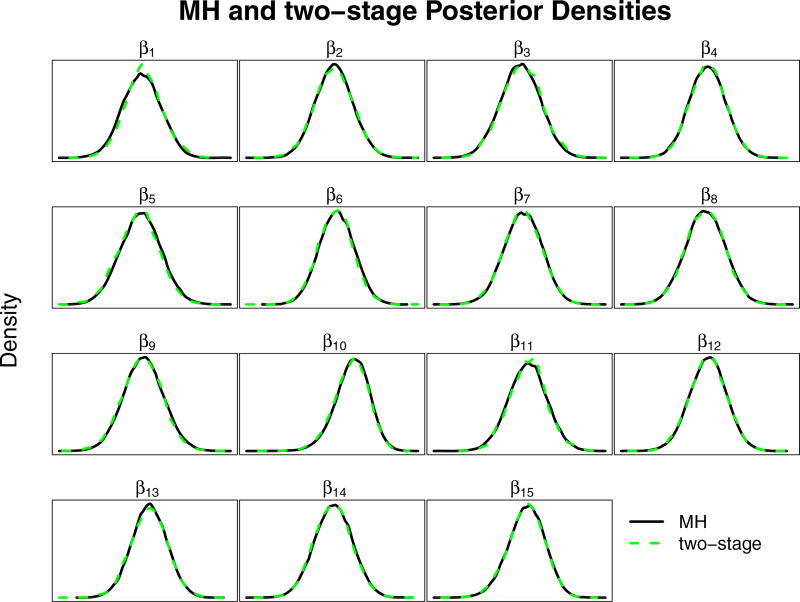
Figure 1.
Posterior densities from the Portuguese bank data, two-stage Metropolis vs. Metropolis-Hastings. The MH and two-stage MH methods are represented by the solid and dashed lines, respectively. (See online version for color.) The posterior densities are nearly indistinguishable between the methods.

