Fig. 2.
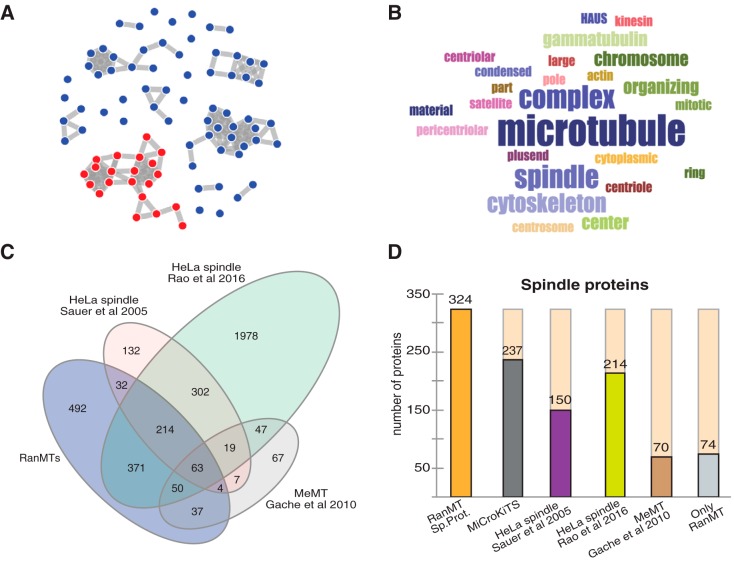
The RanMT proteome. A, Distribution of the GO terms of the RanMT proteome obtained with the online CleverGO tool (analysis conditions: Similarity strength threshold, 0.75; Minimal precision, 0.5; Minimal Lvl, 4; p value cutoff, 0.01). GO terms (represented as dots) more closely related are connected with a gray line. Four major clusters include more than 8 GO terms. The cluster that contains GO terms related to spindles is highlighted in red. B, Word cloud showing the words represented at the GO terms included in the cluster shown in red in (A). Word size is proportional to its frequency in the cluster GO terms. C, Venn-diagram showing the number of proteins identified in our study (RanMT blue) and the overlaps with the HeLa spindle proteomes described by Sauer et al. (8) (pink) and Rao et al. (10) (green) and the MeMT proteome described by Gache et al. (11) (gray). D, Bar graph showing the number of spindle proteins identified in our study (RanMT Sp. Prot., orange bar) and the overlaps with MiCroKiTS (dark gray bar), the HeLa spindle proteomes described by Sauer et al. (8) (magenta bar) and Rao et al. (10) (green bar) and the MeMT proteome described by Gache et al. (11) (brown bar). The number of spindle proteins that are unique to our study is shown on the right (Only RanMT, light gray bar).

