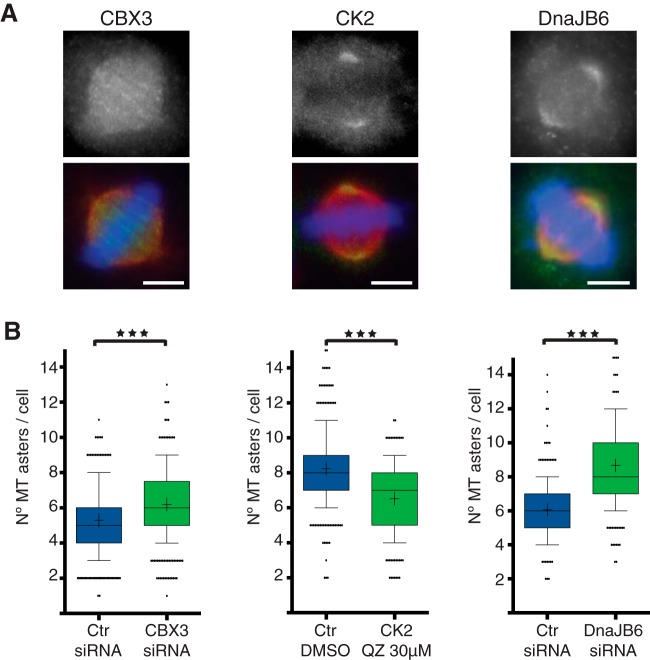
Fig. 3.
Identification of novel SAFs. A, Immunofluorescence images from HeLa cells showing the localization of three proteins identified by mass spectrometry, CBX3, CK2, and DnaJB6 as indicated. Upper row, Immunofluorescence signal detected with antibodies against each of the proteins as indicated. Lower row, overlaid images (in green, signal for each protein as shown above, in red tubulin, and in blue DNA). Scale bar = 5 μm. B, Quantifications of MT regrowth assays in HeLa cells for Control and CBX3 or DnaJB6 silenced cells and for cells incubated with DMSO or with the CK2 inhibitor Quinalizarin (QZ) 30 μm. The graphs show the number of MT asters in mitotic cells fixed 3 min after nocodazole washout. n = 3, experiments performed in different days (total sample size, 413 control and 409 CBX3 silenced cells; 308 control DMSO and 323 QZ incubated cells; 220 control and 223 DnaJB6 silenced cells). Box and whiskers plot, boxes show values between the 25th and the 75th percentiles, with a line at the median and a + at the mean, whiskers extend from the 10th to the 90th percentile and dots correspond to outliers. p value <0.0001 in all cases, obtained by unpaired two tailed t test (for CBX3) or Mann Whitney test (for CK2 and DnaJB6).

