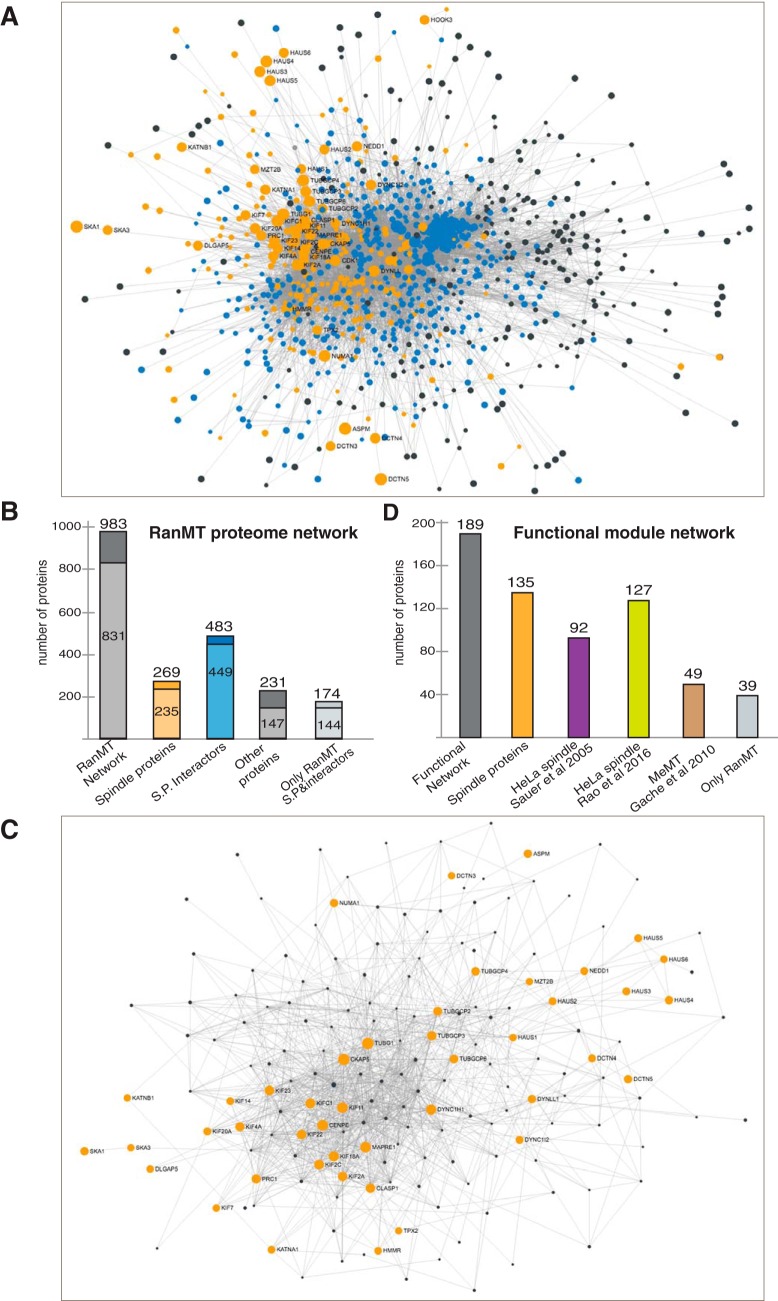
Fig. 4.
Protein-protein interaction networks in the RanMT proteome. A, Network showing experimentally validated protein-protein interactions within the RanMT proteome. Orange nodes represent spindle proteins (defined in the text). Blue nodes represent their first neighbor interactors. Gray dots represent the rest of proteins. Dot size is directly proportional to the number of connections. Gray lines correspond to experimentally validated protein interactions. Most of the proteins are highly connected at the center of the network. B, Bar graph showing the number of proteins identified in our study that are present in the network shown in (A) (RanMT dark gray), the spindle proteins present within the network (orange bar), the proteins connected to the spindle proteins (blue bar), the rest of the proteins (dark gray bar) and the proteins in the network only identified in our study (light gray bar). Within each bar the number of proteins having high connectivity (more than 2 connections) is shown in lighter color. C, Network showing experimentally validated protein-protein interactions within the functional modules as defined in the text (Fig. 3). The orange nodes correspond to the selected key proteins. Gray nodes correspond to their first neighbor interactors. D, Bar graph showing the number of proteins in the Functional module network shown in (B) (gray bar) and the overlaps with the spindle proteins identified in our study (Spindle proteins, orange bar), the HeLa spindle proteomes described by Sauer et al. (8) (magenta bar), and Rao et al. (10) (green bar), the MeMT proteome described by Gache et al. (11) (brown bar). The number of proteins in this network unique to our study is shown on the right (Only RanMT, light gray bar).

