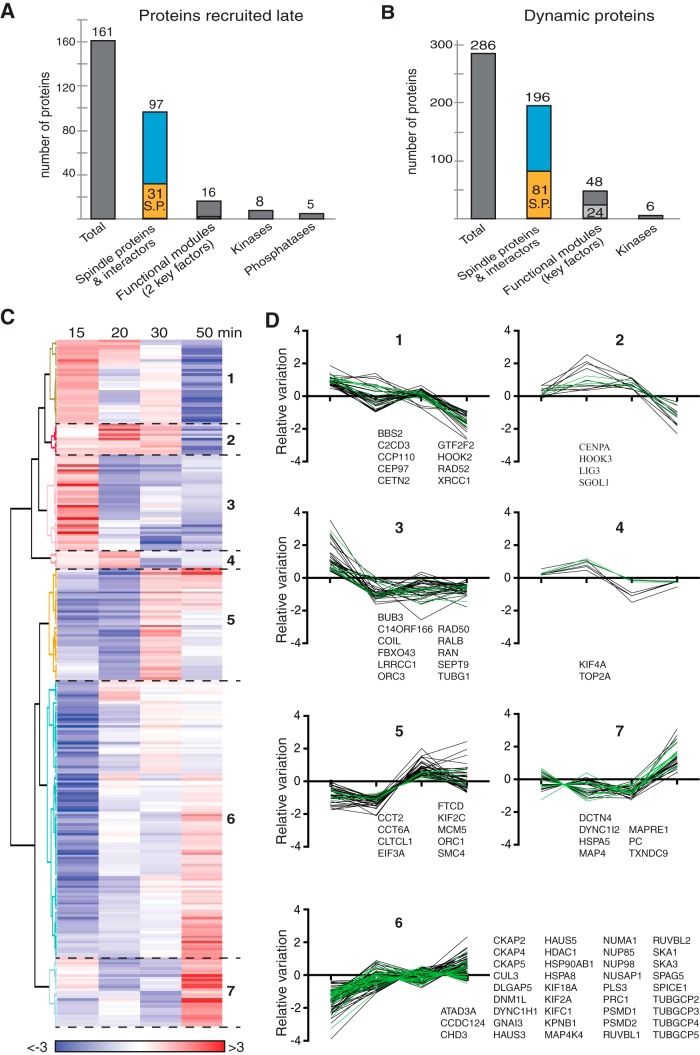
Fig. 5.
Dynamics of the RanMT proteins that associate non-stochiometrically with MTs along the time course of the experiment. A, Bar graph showing the number of proteins that are recruited from 20 or 30 min after initiation of the incubation of egg extracts with RanGTP (Proteins recruited late, left gray bar). The second bar shows the overlap with the RanMT spindle proteins (orange) and their interactors (blue). The third bar shows the proteins present in the Functional module network. The two last bars show the numbers of kinases and phosphatases. B, Bar graph showing the number of RanMT proteins present in all the time-points but binding non-stochiometrically to the MTs (Dynamic proteins, dark gray bar). The second bar shows the overlap with the RanMT spindle proteins (orange) and their interactors (blue). The third bar shows the proteins present in the Functional module network. The number of selected key factors is indicated in light gray. The number of kinases is shown on the left bar. C, Heatmap showing the relative changes in abundance of the 286 dynamic proteins as shown in (B), throughout the time course of the experiment (time of incubation of the EE with RanGTP shown at the top). The unsupervised clustering analysis generated 7 clusters numbered on the right. The color code is indicated at the bottom. D, Profiles of relative abundance of the proteins in the cluster shown in (C). The 0 in the Y axis corresponds to the relative variation of the total tubulin (normalization factor). Each line corresponds to the relative abundance variation of one protein compared with tubulin (see Experimental Procedures). Spindle proteins are shown with green lines. The gene names for the spindle proteins are reported for each graph.

