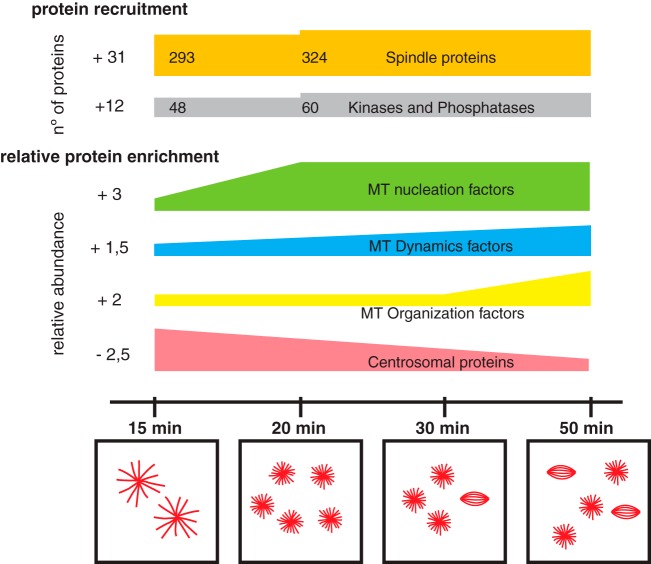
Fig. 6.
Schematic representation of the dynamics of the RanMT proteome. At the top schematic representation of proteins recruitment along the experiment, the number of recruited proteins is indicated at the left side. Spindle proteins are shown in orange and kinases and phosphatases in gray. Below, temporal enrichment general profiles of key functionalities involved in MT self-organization are shown as indicated (total enrichment shown at the left side), as well as the dynamic centrosomal proteins. Temporal scale is shown at the bottom together with representative drawings of characteristic MT assemblies observed at different time points of incubation of egg extracts with RanGTP.

