
Fig. 4.
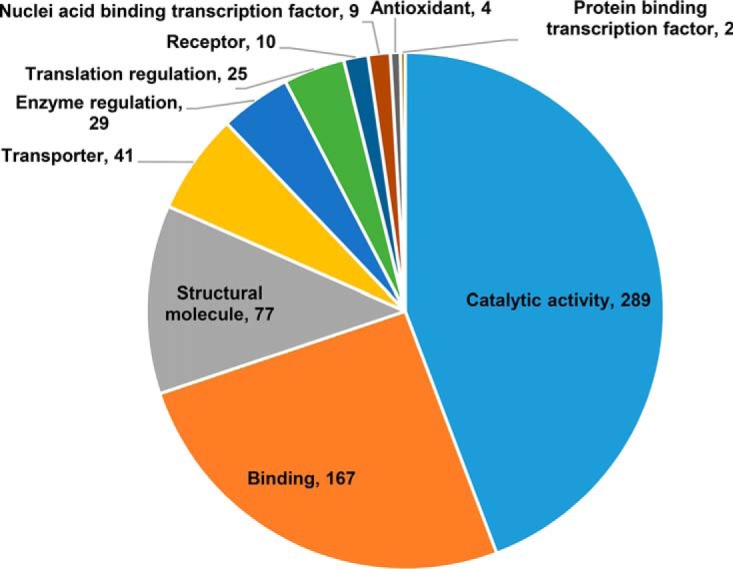
Gene ontology enrichment analysis. Distribution of protein functions for proteins glutathionylated by APAP at any time point. Numerals indicate number of proteins in each category. Some proteins may be listed in more than one category.
Official websites use .gov
A
.gov website belongs to an official
government organization in the United States.
Secure .gov websites use HTTPS
A lock (
) or https:// means you've safely
connected to the .gov website. Share sensitive
information only on official, secure websites.
Gene ontology enrichment analysis. Distribution of protein functions for proteins glutathionylated by APAP at any time point. Numerals indicate number of proteins in each category. Some proteins may be listed in more than one category.