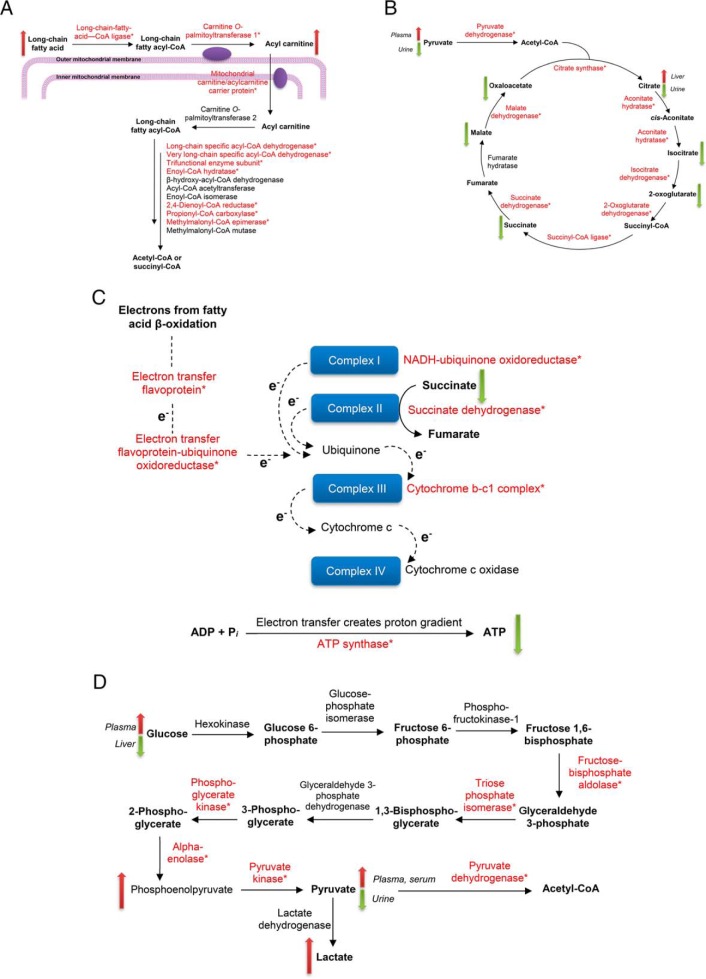
Fig. 6.
Proteo-metabonomic mapping of glutathionylated proteins. Glutathionylated proteins in each map are marked with an asterisk, and up/down arrows indicate the direction of change (increase/decrease) for relevant metabolites. Where divergent changes were reported in literature, the corresponding biological matrices used to perform the measurements are indicated in italics. A, Fatty acid β-oxidation. B, Krebs cycle. C, Oxidative phosphorylation. D, Glycolysis.

