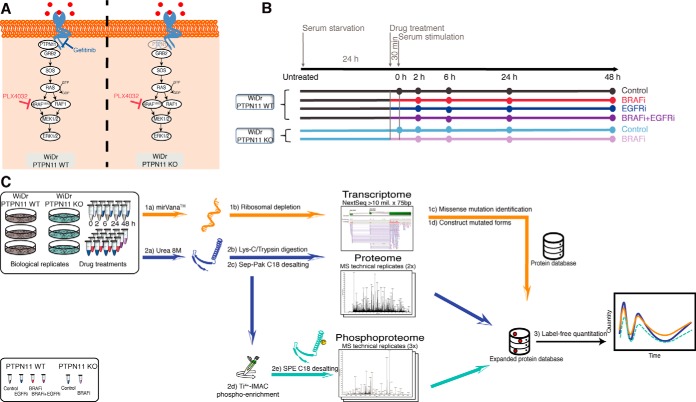
Fig. 1.
Study design. A, Biological model. Schematic representation of the MAPK signaling pathway whereby BRAF(V600E), the drugs and KO target sites are highlighted. B, Experimental design. WiDr and WiDr PTPN11 KO cells were cultured for transcriptome, proteome and phosphoproteome analysis. For each of the six treatments the time-course of events is indicated (Experimental Procedures). Color codes are utilized to differentiate the effect due to drug inhibition in PTPN11 WT with respect to the knock-out of PTPN11 KO by distinguishing BRAFi-treated samples (red and shades of purple) from not BRAFi-treated samples (gray and shades of blue). C, Workflow employed in this study. For the transcriptomics analysis, mRNA libraries were prepared and sequenced using Illumina NextSeq. Quantitation in proteomics and phosphoproteomics analysis was done by label-free quantitation. Phosphoproteomics was performed after Ti4+-IMAC phosphopeptide enrichment. For the integration of transcriptome, proteome and phosphoproteome approach, a customized protein database was developed to include identified missense mutations for peptide identification and quantification (Experimental Procedures).

