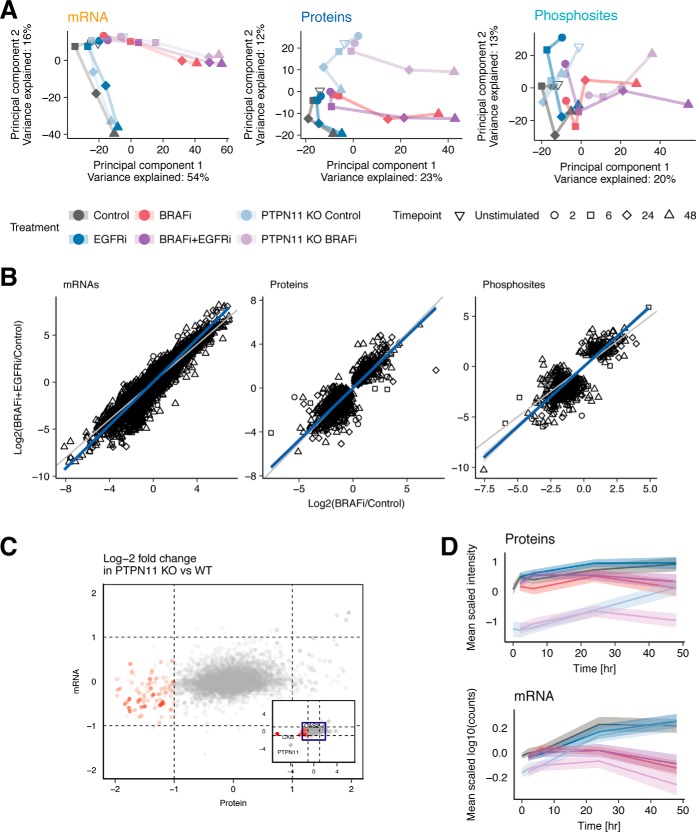
Fig. 3.
Comparisons between drug treatments and omics data types. A, Principal Component Analysis (PCA) of transcriptomics, proteomics and phosphoproteomics data elucidates similar global trends in the data. B, Correlation plots of log2-fold-changes in BRAFi and BRAFi+EGFRi compared with Control, for each data set. The gene/protein/phosphosite-time point pairs selected are significantly differentially expressed for at least one of the two treatments. C, Scatterplot of log2-fold-changes of protein (x axis) and mRNA (y axis) levels in PTPN11 KO compared with PTPN11 WT cells reveals set of 77 genes downregulated at protein level but with no expression difference at RNA level. D, Average expression profiles of the 77 proteins (red dots in B) that are downregulated at the protein but not at the mRNA level. The expression of each mRNA/protein is mean-centered. The solid lines indicate mean expression of the 77 mRNA/proteins and the shaded area indicates the 95% confidence interval of the mean.

