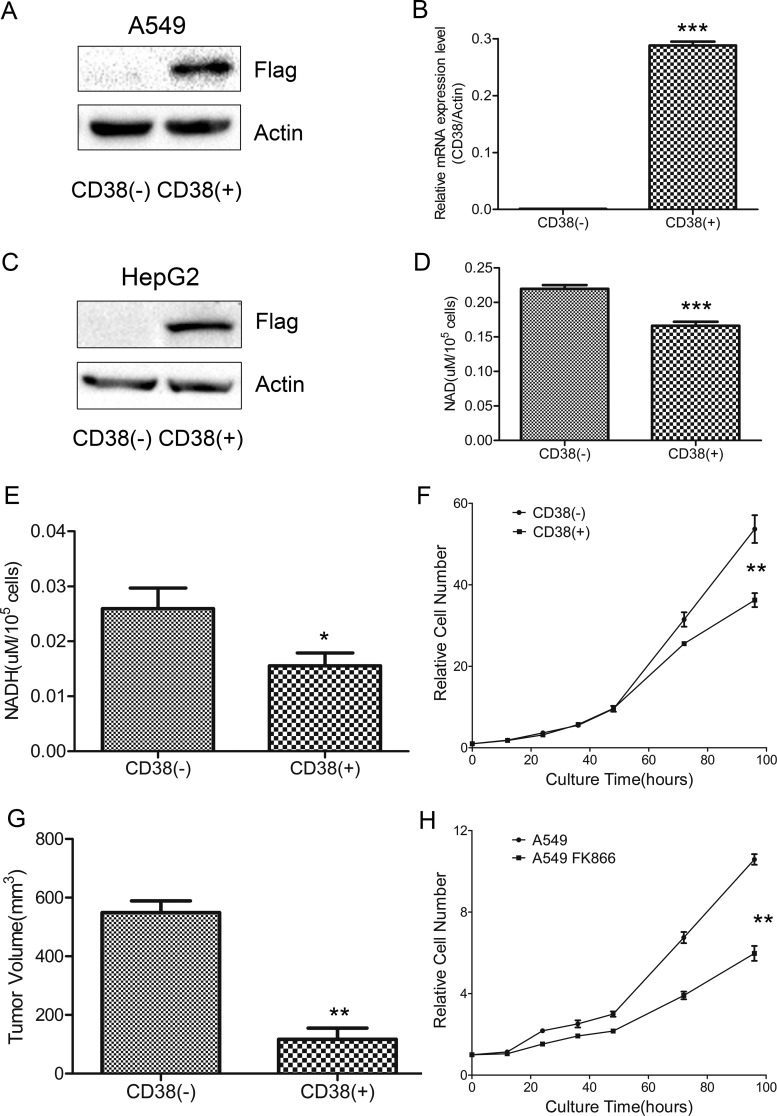
Fig. 1.
Lowering cellular NAD levels decreases cell growth rate. A, Western blotting confirmed CD38 overexpression in A549 cells. B, qPCR analysis confirmed overexpressed CD38 mRNA levels in A549 cells (n = 3). C, Western blotting confirmed CD38 overexpression in HepG2 cells. D, E, Cellular NAD and NADH levels in CD38(−) and CD38(+) A549 cells (n = 3). F, Growth curves of CD38(−) and CD38(+) A549 cells determined by CCK-8 assay (n = 3). G, Tumor samples harvested from mice 37 days after injection (n = 3). Tumor volumes (mm3) were measured using digital calipers and calculated using the formula: π/6 × length (mm) × width2 (mm). H, Growth curves of untreated- and 10 nm FK866-treated A549 cells determined by CCK-8 assay (n = 3). Data were analyzed using Student's t test. *p < 0.05; **p < 0.01; ***p < 0.001. *p < 0.05 was considered statistically significant. All values represent mean from at least three biological replicates ± S.E.

