Fig. 2.
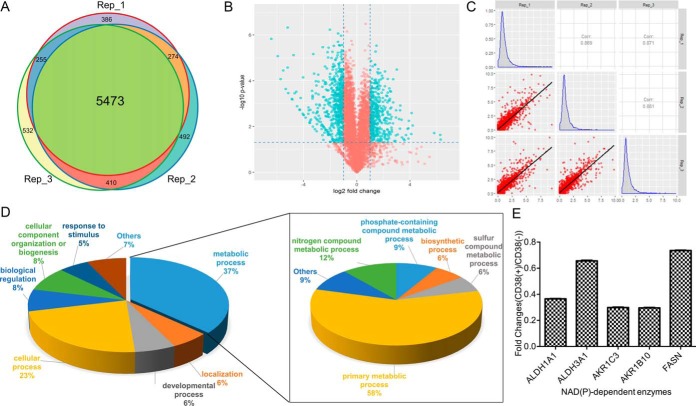
Proteomic analysis of CD38(−) and CD38(+) cells. A, Venn diagram showed that proteomic data were highly reproducible. B, Volcano plots showed significantly changed proteins (labeled in blue) between CD38(+) and CD38(−) A549 cells with fold-change > 2 or < 0.5 and adjusted p value < 0.05 from t test statistics. C, Pearson correlation diagram embedded with a histogram revealed that protein fold-changes in our proteomic data showed normal distributions. High Pearson correlation coefficient indicates high correlation of protein fold-changes between three independent experiments. D, Functional classification of downregulated proteins between CD38(−) and CD38(+) A549 cells by PANTHER (http://www.pantherdb.org). E, SILAC ratios for NAD(P)-dependent enzymes.

