Fig. 3.
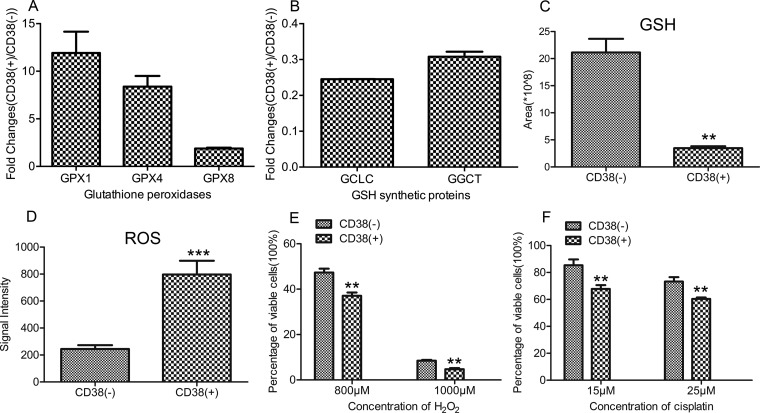
CD38 overexpression increases ROS levels and susceptibility to oxidative stress. A, SILAC ratios for three GSH peroxidases. B, SILAC ratios for GSH synthetic proteins. C, Graphical representation of relative concentrations of GSH in CD38(−) and CD38(+) A549 cells by metabolomic analysis (n = 3). D, Graphical representation of cellular ROS levels in CD38(−) and CD38(+) A549 cells (n = 3). E, Percentage of viable cells between CD38(−) and CD38(+) A549 cells treated with different concentration of H2O2 (n = 3). F, Percentage of viable cells between CD38(−) and CD38(+) A549 cells treated with different concentration of cisplatin (n = 3). Data were analyzed using Student's t test. **p < 0.01. *p < 0.05 was considered statistically significant. All values represent mean from at least three biological replicates ± S.E.

