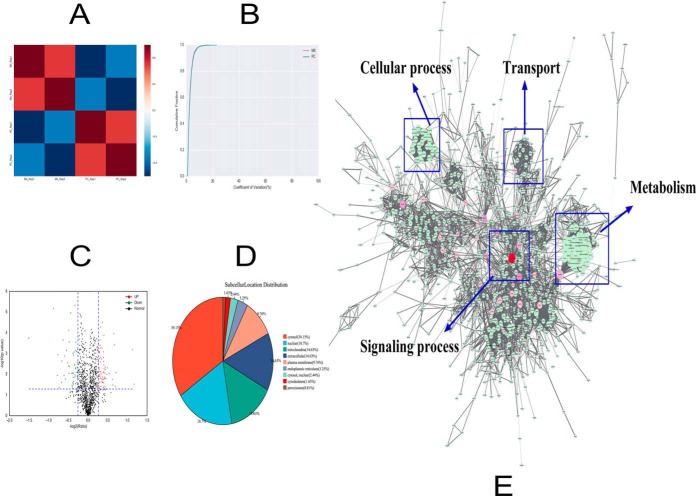
Fig. 1.
A, The correlations between the protein expression levels of each sample were calculated by using the Pearson correlation coefficient. The red represents the MII stage and the blue represents the two-cell stage after parthenogenetic activation. B, The coefficient of variation (CV) is used to reflect the degree of discretization of each sample data, which is the ratio of the standard deviation of the data to the mean, expressed as a percentage (CV = [standard deviation/average value] × 100%). The horizontal axis is the CV value, and the vertical axis represents the proportion of total protein. The red line represents the MII stage and the green line represents the two-cell (that is, the parthenogenetic cleavage [PC]) stage. C, Each point in the volcanic map represents a protein; the abscissa represents the logarithmic value of the expression of a certain protein in the two samples. The green point represents the downregulation of the expressed protein, the red point represents the upregulated differential expression protein, and the black dot represents the non-differentially expressed protein. D, An analysis of the distribution of proteins in the subcellular structure found that the were mainly located in the cytosol (34.15%), nucleus (18.70%), mitochondria (14.63%), extracellular matrix (14.63%), and plasma membrane (9.76%). E, The interaction between the identified proteins visualized using Cytoscape 3.2.1 software. The color of the node is represented by the betweenness, which means the influence in the network; if the color is redder, the influence is greater. The size of the node is represented by the degree, which means the stability in the network; if the shape is bigger, the stability is stronger. Using the BinGO package, we found that the identified proteins were mainly involved in the following processes: regulation of biological processes, metabolism, transport, cellular process, and signaling process.

