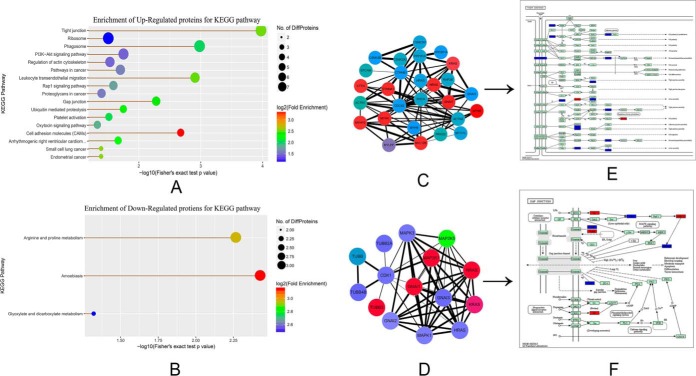
Fig. 3.
Statistics of regulated enrichment from KEGG pathway analysis. A–B, The KEGG pathway enrichment of differently expressed protein. The size of the node is represented by the number of the enriched proteins; if the size is larger, the number is larger. The color represents the fold-change enrichment; the darker the red color, the greater the fold change. A, The KEGG pathway enrichment of upregulated proteins. B, The KEGG pathway enrichment of downregulated proteins. The interaction visualization and KEGG mapping for tight junctions and gap junctions (C–F). The red nodes represent the upregulated proteins, and green nodes represent the downregulated proteins. C, The interaction visualization of tight junctions; D, the interaction visualization of gap junctions; E, the KEGG mapping of tight junctions; and F, the KEGG mapping of gap junctions.

