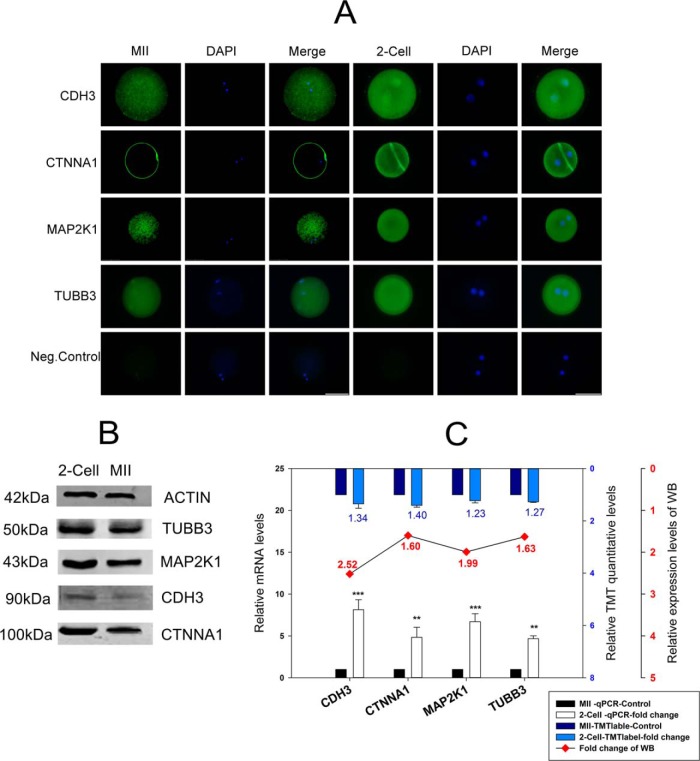
Fig. 5.
The validation of four proteins (CDH3, CTNNA1, MAP2K1, TUBB3) involved in gap and tight junctions. A, Cellular immunofluorescence localization analysis. The last line in the figure is a negative control, Bar, 50 μm; B, Western blot analysis. β-actin was used as a loading control. C, The combination chart showing the fold change for the tandem mass tag (TMT) quantitative data. The figure shows mRNA expression levels and gray values of the Western blotting. The blue columns represent the TMT quantitative data, the white columns represent mRNA expression levels, and the line chart represents the gray value of the Western blotting. All the above analyses used the MII stage as a control. The data on mRNA expression levels are represented as means ± standard deviation (S.D.); **, p < 0.01; ***, p < 0.001. The TMT quantitative data are represented as means ± S.D., and its difference standard is the fold change > 1.2, and the p value < 0.05. The fold change of the Western blotting is dependent on the gray value of each line from the MII stage and the two-cell stage of each protein.

