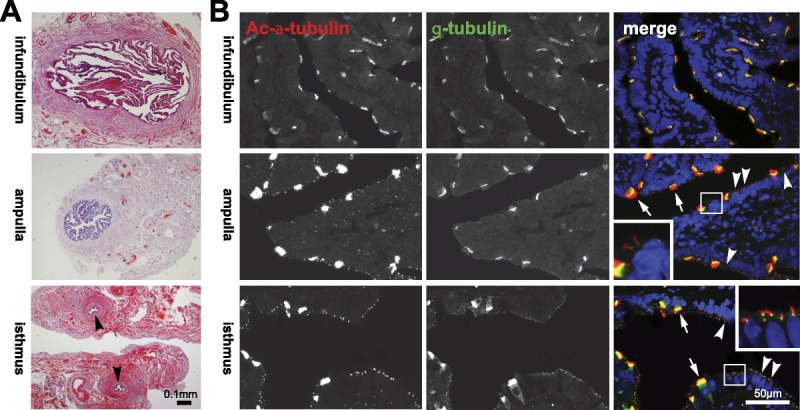
FIGURE 2.

Regional distribution of MCC and primary cilia in the human FT. A, Transverse sections of the FT at the level of the infundibulum, ampulla, and isthmus (indicated by arrowheads), counterstained with H&E. Scale bar = 0.1 mm. B, FT sections at the indicated anatomical regions IF stained for acetylated (Ac) α-tubulin (red; a marker of ciliary axonemes in both MCCs and primary cilia) and γ-tubulin (green; a marker of the ciliary basal body in both cilia types). Nuclei were counterstained with DAPI (blue). Merged color channels are shown on the right. Arrows indicate MCCs and arrowheads indicate primary cilia, with detail shown in magnified insets. Single immotile primary cilia are displayed on secretory peg cells. Scale bar = 50 μm.
