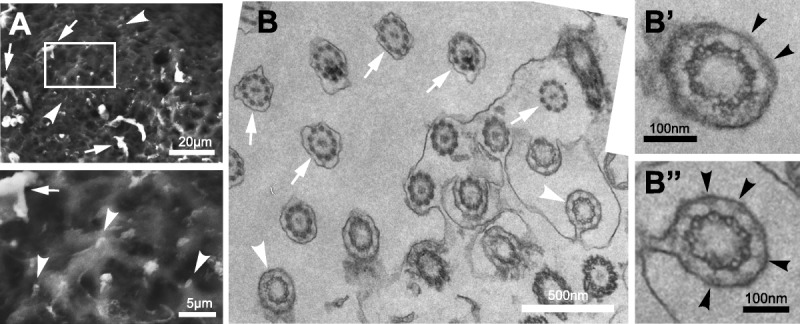
FIGURE 3.

Scanning and transmission electron microscopy of cilia in the human FT. A, Scanning electron microscopy of fresh frozen mucosal layer tissue specimens of FT from the ampulla region. Arrows indicate MCCs and arrowheads indicate primary cilia, with detail shown in magnified insets. The frame indicates the region shown magnified in the lower panel. Scale bars 20 or 5 μm, as indicated. B, Transmission electron microscopy imaging of transverse sections of FT in the ampulla region, arranged in a photomosaic, at the level of transition zones in primary cilia. Arrows indicate MCCs and arrowheads indicate primary cilia. Scale bar = 500 nm. Magnified regions (B’ and B”) show individual primary cilia, with the Y-shaped links of the ciliary transition zone indicated by black arrowheads Scale bars = 100 nm.
