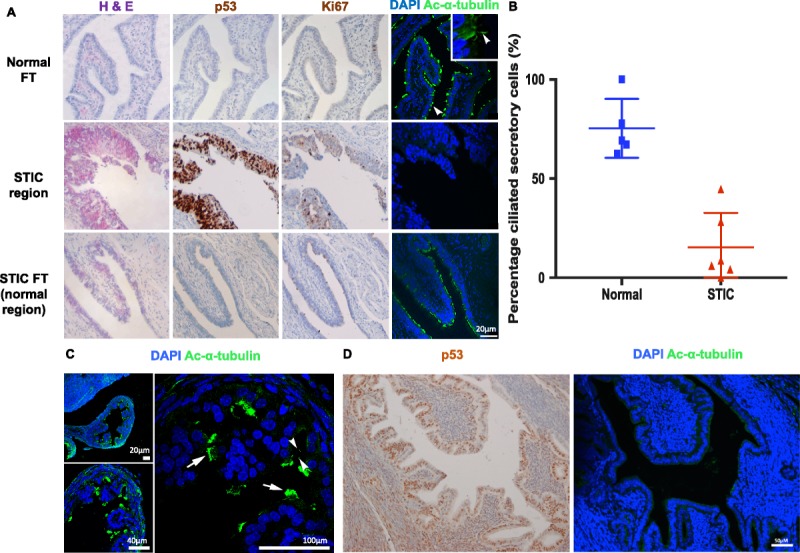
FIGURE 5.

Loss of primary cilia in human and mouse STIC FT secretory cells. A, Images of serial longitudinal sections of paraffin-embedded human FT stained with H&E, anti-p53, and anti–Ki-67 antibodies. H&E staining was used to identify regions of STIC with confirmatory p53 and Ki-67 staining. Confocal images were captured at 40× magnification. Sections were stained with DAPI (blue) and anti–acetylated α-tubulin (green) to mark nuclei and ciliary axonemes, respectively. An example of a primary cilium is indicated by the arrowhead. Loss of epithelial cilia was observed in STIC regions identified by H&E on serial sections. Non-STIC epithelial regions within the same FT or matched FT still had an abundance of primary cilia. Scale bar = 20 μM. B, The incidence of primary cilia on secretory cells was quantified in the outermost layer of epithelial cells. The graph shows the percentage of secretory cells with cilia, calculated within each STIC region for patients 1 to 6, and in matched normal fimbrial end regions in either the same FT or the contralateral FT. Pairwise statistical comparison between the percentage of primary cilia on secretory cells in these regions was determined using an unpaired Student t test (P < 0.0002). One to 4 fields of view were used to determine the mean values for each sample; error bars indicate s.e.m. C, Wild-type mouse FT fimbriae sections stained for acetylated α-tubulin (green) to mark cilia were imaged at 20×, 40×, and 100× magnification. Nuclei were counterstained with DAPI (blue). Primary cilia are indicated by arrowheads and MCCs by arrows. D, The mouse STIC model shows loss of primary cilia from secretory cells. Left panel: regions of STIC were defined by H&E and p53 positive staining in the FT epithelium using IHC. Right panel: IF imaging at 40× magnification of the corresponding region of STIC, stained with DAPI (blue) and acetylated α-tubulin (green). Scale bars = 50 μm.
