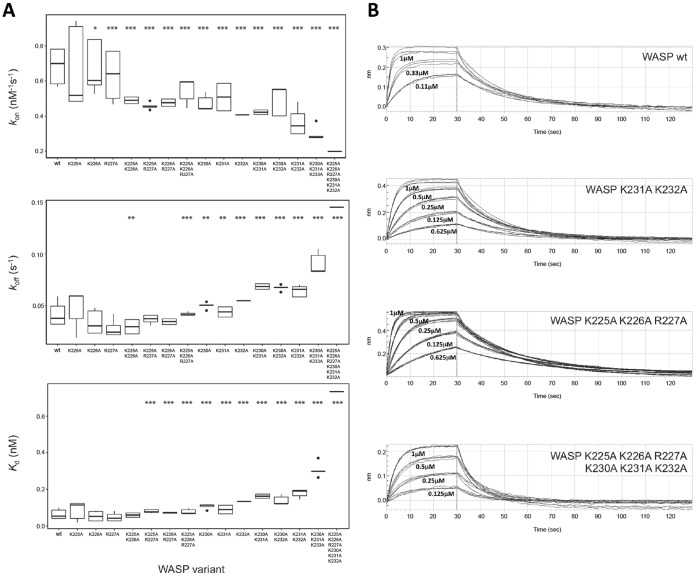
Figure 5.
Binding kinetics for WASP BR mutants measured by bio-layer interferometry. GST fusion proteins were loaded onto anti-GST sensors and dipped alternately into a concentration range of Cdc42·GMPPNP (of at least three different concentrations) and buffer to measure on- and off-rates. A, data for kon, koff, and Kd, where n = 3–9 independent experiments, plotted as boxplots showing median and quartile values with data outlying the distribution appearing as dots for all mutants. Statistical significance from WT values is indicated as follows: *, p ≤ 0.05; **, p ≤ 0.01; ***, p ≤ 0.001 as analyzed by t test with the false discovery rate controlled by the Benjamini-Hochberg method (analysis performed in R). Note: K225A/K226A value is statistically significantly lower than the WT but not than the other single mutations in the N-terminal triad; therefore, this is most likely a false discovery error. B, raw data from representative experiments. The fitted values from these data are reported in Table 4.

