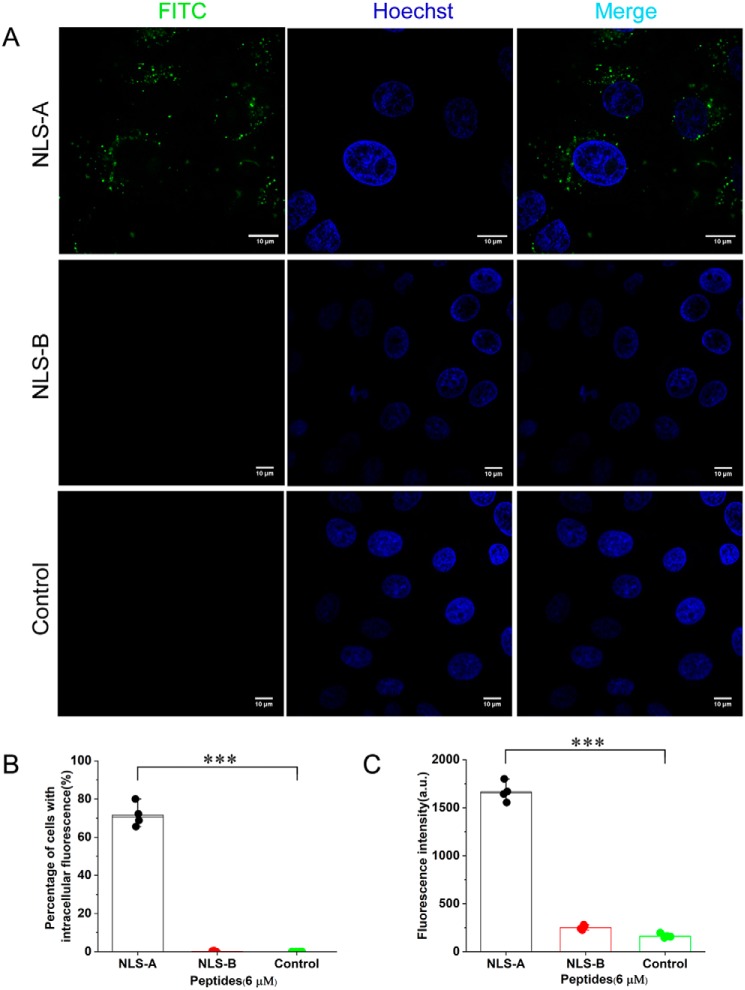
Figure 3.
FITC-conjugated NLS-A entered PK15 cells. A, PK15 cells were incubated with 6 μm FITC-conjugated NLS-A (upper row) or 6 μm FITC-conjugated NLS-B (middle row) for 30 min and washed three times with PBS before imaging with a dual-channel confocal laser-scanning microscope (Nikon TiE). A third test with Opti-MEM incubation only was used as a treatment control (bottom row). Green indicates FITC signal in the cells, and cell nuclei (blue) are indicated by Hoechst. B, bar graph summarizing the percentage of the PK15 cells with FITC fluorescence under the above three incubation treatments (n = 4; error bars represent S.D.; ***, p < 0.001). C, bar graph summarizing fluorescence intensity of the PK15 cells under the above three incubation treatments (n = 4; error bars represent S.D.; ***, p < 0.001). All scale bars represent 10 μm. a.u., arbitrary units.

