Figure 5.
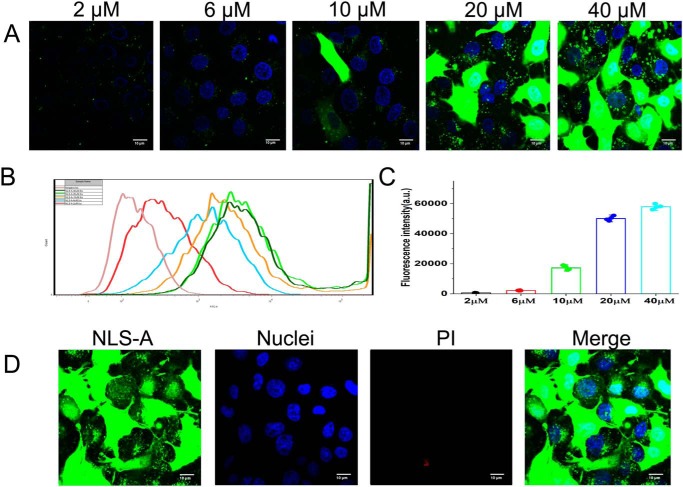
Cellular uptake of NLS-A is concentration-dependent. A, PK15 cells were incubated with serial concentrations of FITC-conjugated NLS-A (2, 6, 10, 20, and 40 μm) for 30 min at 37 °C and washed three times with PBS before imaging with a dual-channel confocal laser scanning microscope (Nikon TiE). Green indicates FITC signal in the cells, and cell nuclei (blue) are indicated by Hoechst. B, PK15 cells were incubated with serial concentrations of FITC-conjugated NLS-A (2, 6, 10, 20, and 40 μm) for 30 min at 37 °C. After the cells were trypsinized and washed, the cellular FITC fluorescence intensity of each treatment was analyzed by flow cytometry (BD FACSVerse). Flow cytometry results were processed by FlowJo software. C, bar graph summarizing the fluorescence intensity of the PK15 cells under the incubation treatments with the indicated NLS-A concentration (n = 4; error bars represent S.D.). D, PK15 cells under treatment of a high concentration of NLS-A (40 μm) were further stained by PI for viability test. All scale bars represent 10 μm. a.u., arbitrary units.

