Figure 6.
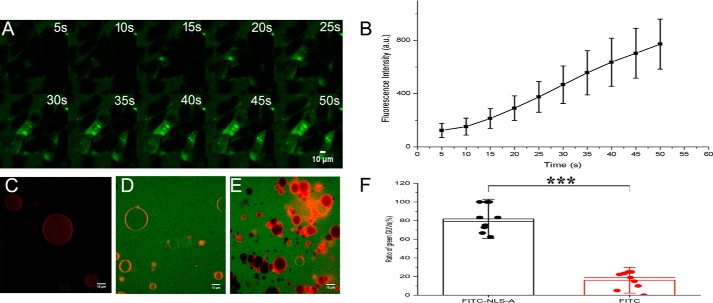
Rapid entry of the NLS-A into PK15 cells by penetrating the membranes. A, time lapse of NLS-A internalization after PK15 cells were treated with 40 μm peptide. Images were acquired at 5-s intervals. Green represents FITC-conjugated NLS-A in cells. B, bar graph summarizing the mean fluorescence intensity at each time point (n = 100; error bars represent S.D.) C–F, GUVs with encapsulated atto565 dye (red) in the absence of NLS-A (C) or the presence of the FITC-conjugated NLS-A (20 μm) (D). As a control, FITC alone (20 μm) was added into the GUV solution (E). F, ratios of GUVs containing FITC fluorescence (green). Data are represented as the mean ± S.D. (error bars) of 100 individual GUVs from 10 microscopic fields. ***, p < 0.001. Note that confocal images were collected after 1-h incubation of FITC-conjugated NLS-A, FITC alone, or buffer with GUV solutions, respectively. Membranes were visualized by DiI staining. All scale bars represent 10 μm. a.u., arbitrary units.

