Figure 7.
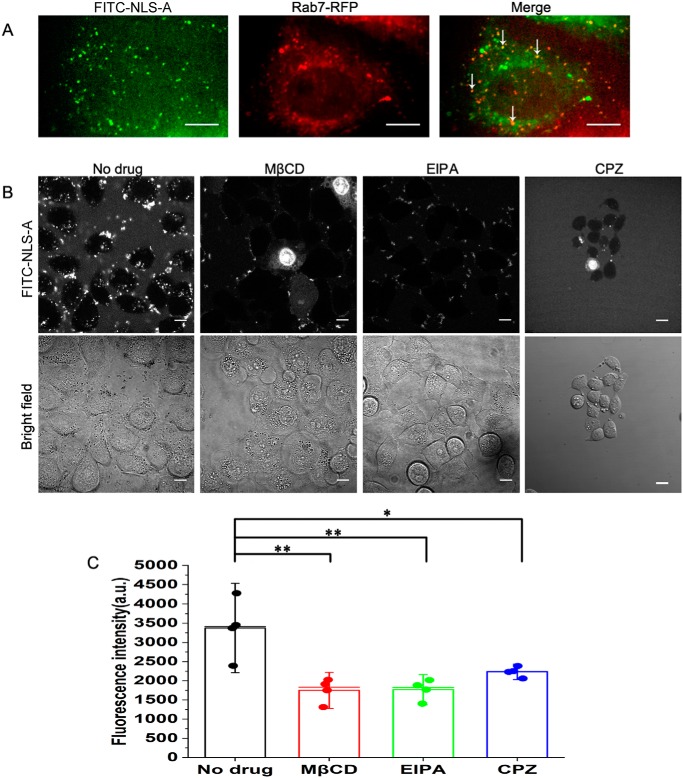
Cellular uptake of NLS-A via multiple endocytosis pathways. A, distributions of NLS-A (left) and Rab7 (middle) in PK15 cells. Colocalizations of NLS-A (6 μm) and Rab7 are indicated by arrows (right). Scale bars, 10 μm. B, effects of various inhibitors on cellular uptake of NLS-A (6 μm). Signals (top panel) indicate internalization of the NLS-A in PK15 cells. In the bottom panel, cells were examined with bright-field microscopy. Scale bars, 10 μm. C, mean fluorescence intensity per cell among four groups was analyzed by flow cytometry (*, p < 0.05; **, p < 0.01; error bars represent S.D.). a.u., arbitrary units; CPZ, chlorpromazine; EIPA, N-(ethyl-N-isopropyl)-amiloride; MβCD, methyl-β-cyclodextrin.

