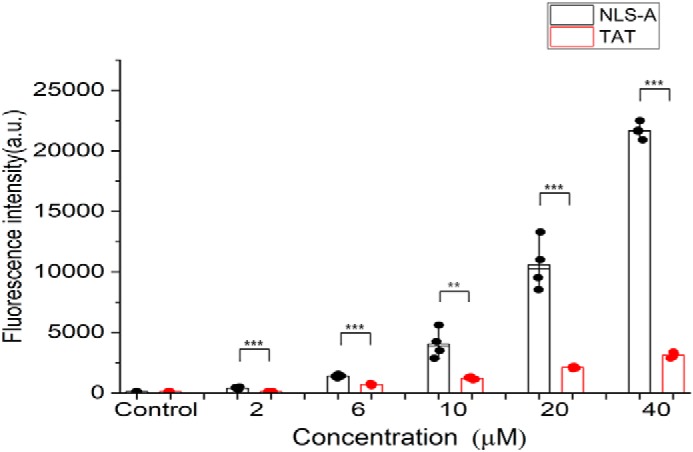
Figure 8.

Cellular uptake of NLS-A is more efficient than HIV TAT at various concentrations. PK15 cells were incubated with increasing concentrations of NLS-A or HIV TAT (x axis) at 37 °C for 30 min and subjected to flow cytometry analysis. The y axis represents the average fluorescence intensity per group. Data are represented as the mean ± S.D. (error bars) of four independent experiments (**, p < 0.01; ***, p < 0.001). a.u., arbitrary units.
