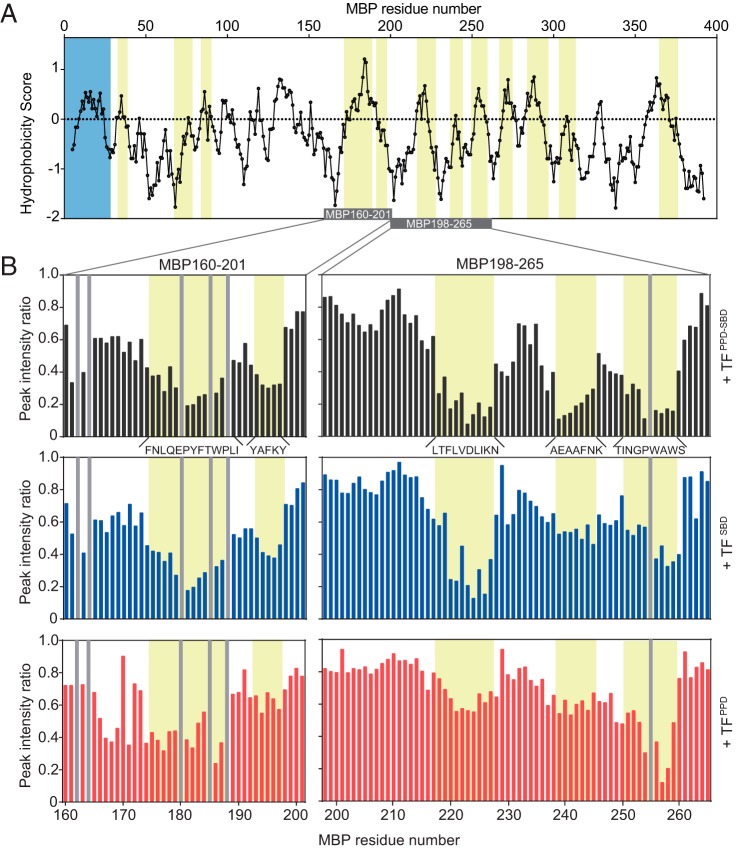
Figure 1.
Recognition of unfolded MBP by TF. A, plot of the hydrophobicity score (Roseman algorithm, window = 9) of MBP as a function of its primary sequence. A hydrophobicity score higher than 0 denotes increased hydrophobicity. The regions recognized by TF as identified by NMR titration experiments are highlighted in yellow. The signal sequence is highlighted in blue. The MBP segments depicted in the B are indicated as a gray bar. B, plots of peak intensity change of MBP160–201 (left panels) and MBP198–265 (right panels) by the addition of TFPPD-SBD at a ratio of MBP:TFPPD-SBD 1:0.1 (top panels), TFSBD at a ratio of MBP:TFSBD 1:0.2 (middle panels), and TFPPD at a ratio of MBP:TFPPD 1:0.5 (bottom panels), as a function of the primary sequences of the MBP peptides. The regions recognized by TF are highlighted in yellow and labeled with the primary sequences. The proline residue and unassigned residue are indicated by gray bar.

