Figure 2.
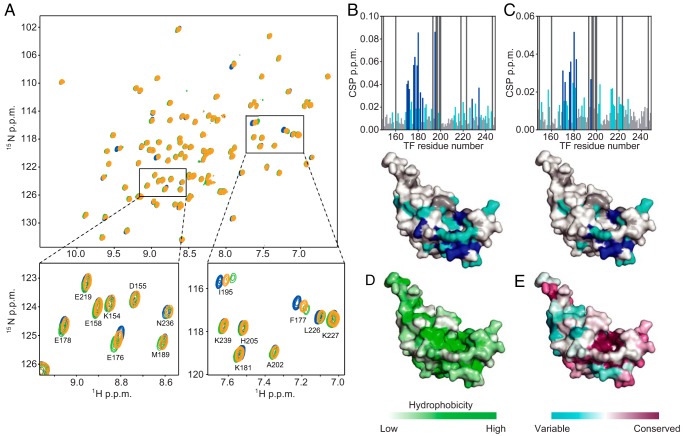
The substrate-binding sites on TFPPD. A, 1H-15N HSQC spectra of TFPPD in the absence (blue) and presence of MBP160–201 (green) or MBP198–265 (orange). The spectra were recorded with several titration points, TFPPD:MBP 1:0.1, 1:0.2, 1:0.5, 1:1, and 1:2, but only the spectra at 1:2 ratio are shown for clarity. The regions indicated by boxes in the top panel are expanded in the bottom panels with resonance assignments. B and C, chemical shift perturbations of amide moieties of TFPPD upon binding to MBP160–201 (B) or MBP198–265 (C), plotted as a function of the residue number of TFPPD. Proline and unassigned residues are indicated by bars colored dark gray. The lower panels show chemical shift perturbation mapping on the structure of TFPPD (PDB code 1W26). The residues with perturbations larger than the threshold values of 0.015 and 0.025 ppm are colored light blue and dark blue, respectively. Proline and unassigned residues are colored dark gray. D, mapping of the hydrophobicity on the structure of TFPPD. E, TFPPD sequence conservation mapped on the structure of TFPPD.

