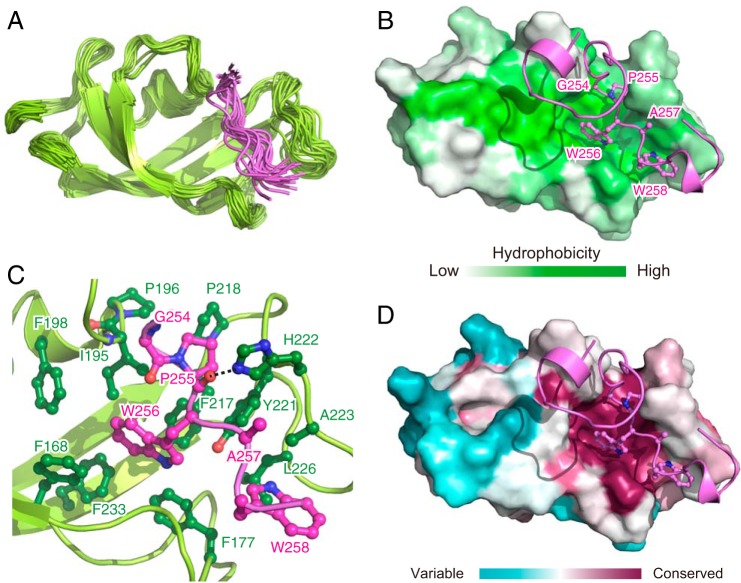
Figure 3.
NMR structure of TFPPD in complex with MBP. A, superimposition of 20 structures of TFPPD in complex with MBP 238–266. For MBP, only the converged region, Asn253–Ser259, is shown for clarity. TFPPD and MBP are shown in green and pink ribbons, respectively. B and D, the lowest-energy structure of MBP–TFPPD complex. TFPPD is shown as a solvent-exposed surface to which the hydrophobicity (B) or the conservation of the amino acid residues (D) is mapped. MBP is shown as pink ribbons. The MBP residues that directly interact with TFPPD are drawn in a ball-and-stick representation. C, close-up view of the lowest-energy structure of MBP–TFPPD complex. TFPPD and MBP are shown as green and pink ribbons, respectively. The residues of TFPPD and MBP involved in the interaction are drawn in a ball-and-stick representation and colored green and pink, respectively.

