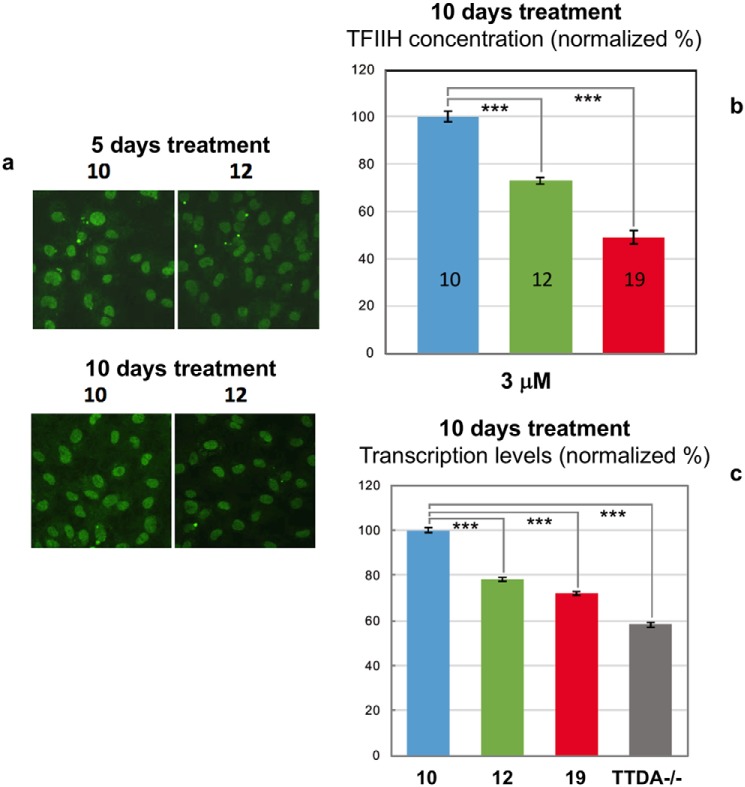
Figure 7.
Reduction of TFIIH steady-state and transcriptional activity. a, typical examples of XPB-YFP–expressing cells, 5 and 10 days after continued treatment with compounds 10 and 12 at 1 μm concentration. b, results for the quantification of TFIIH levels via measurement of total XPB-YFP intensities in the nucleus of cells treated with 3 μm compounds 10, 12, and 19 after 10 days of treatment. c, results for the quantification of transcriptional activity in cells treated 10 days with compounds 10, 12, and 19 and in XPB-YFPTTDA−/− cells. Error bars, S.E. ***, p < 0.001, Student's t test (two tailed, assuming unequal variances).

