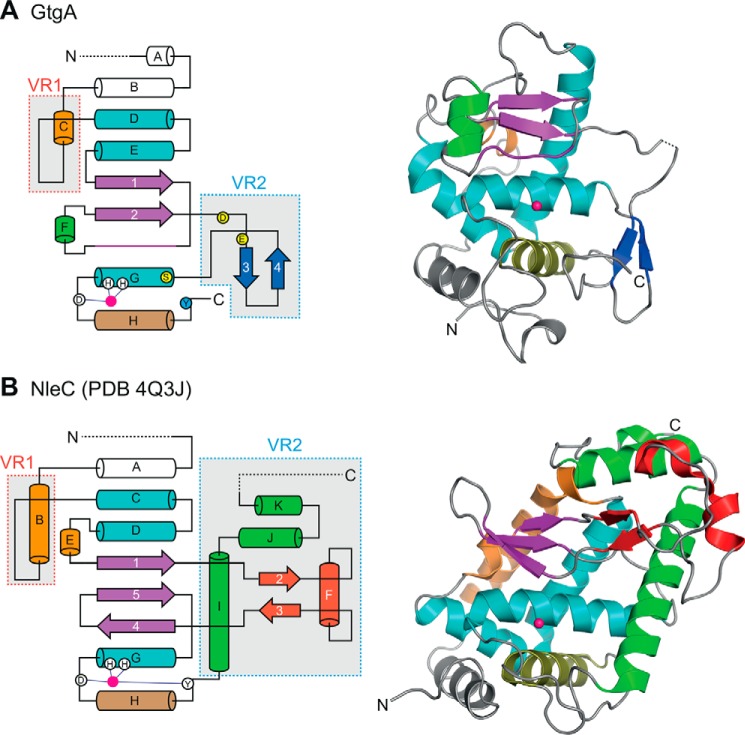
Figure 7.
Structural comparison of GtgA and NleC. Topological and cartoon representations of GtgA (A) and NleC (B) (PDB 4Q3J). The Zincin-like catalytic core is colored as in Fig. 3C; α-helices are colored teal, and the β1β2 β-sheet and the active-site upper rim residues are colored purple. Variable features are colored in orange, blue, red, and green, and the catalytic zinc ions are shown as pink spheres. Dashed lines represent either disordered residues or regions outside the crystallized constructs. In the topological diagrams, zinc-coordinating residues are shown as white circles, and the active-site zinc is shown as a pink circle. GtgA residue Tyr-224 is shown as a blue circle, and GtgA S1′ pocket residues Asp-155, Glu-163, and Ser-179 are shown as yellow circles.

