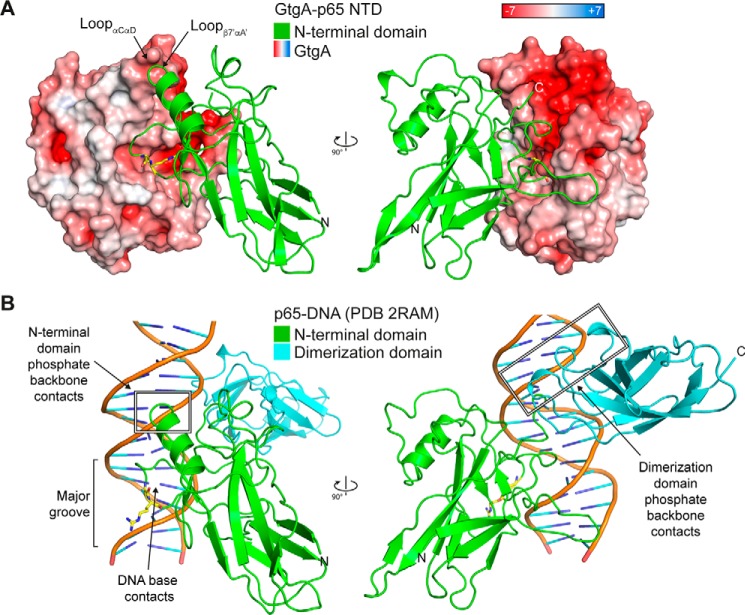
Figure 8.
DNA mimicry by GtgA. A, surface representation of GtgA colored according to its electrostatic surface potential (positive blue, negative red), in complex with the NTD of p65. B, cartoon representation of the p65 RHR in complex with DNA (PDB 2RAM) (11). In both panels, the p65 cleavage site residues (Gly-40/Arg-41) are represented as yellow sticks.

