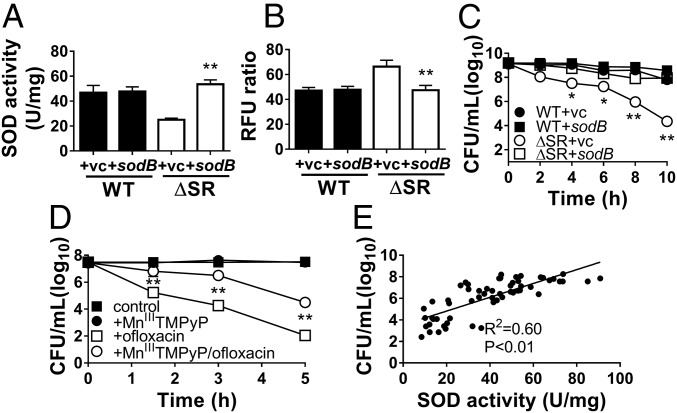
Fig. 4.
Complementation of SOD activity restores superoxide levels and rescues ofloxacin tolerance in the ΔSR mutant. Stationary-phase WT and ΔSR cells carrying the pBAD-sodB (+sodB) or control (+vc) vector were assayed for (A) total SOD activity, (B) relative superoxide levels (DHE/EtBr fluorescence ratio), or (C) killing by 5 µg/mL ofloxacin. (D) Stationary-phase ΔSR cells pretreated ± the SOD mimetic MnIIITMPyP before challenge with 5 µg/mL ofloxacin. All results are shown as mean ± SEM (n ≥ 6). *P < 0.05 and **P < 0.01 vs. WT +vc (in A to C) or vs. “+ofloxacin” (in D). (E) Correlation between bacterial viability of stationary-phase cells after ofloxacin challenge and SOD activity. The SOD activity was measured in stationary-phase cultures before ofloxacin challenge, and bacterial viability of the same culture was measured after 10-h challenge of 5 µg/mL ofloxacin. Data from different strains (WT, ΔSR, ΔSR +sodB, ΔSR +sodA, +SR) were combined and each data point represents an independent replicate (n ≥ 40). The correlation coefficient R2 was calculated using linear regression.

