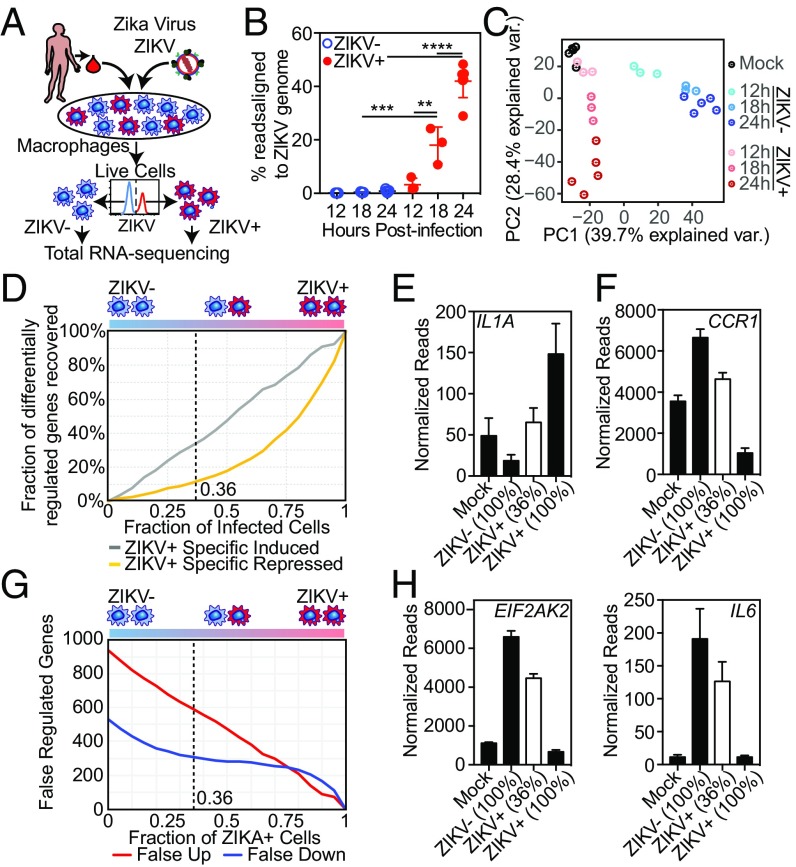
Fig. 1.
ZIKV modulates macrophage transcription during infection. (A) Diagram depicting the infection model. HMDMs are infected with ZIKV and stained for ZIKV group antigen followed by FACS isolation of live, productively infected ZIKV+ and bystander (ZIKV−) macrophages. (B) Percent of RNA-seq reads aligning to the ZIKV genome in FACS-isolated ZIKV+ and ZIKV− macrophages at the indicated time points PI. Percent was calculated as the total reads aligning to ZIKV alone vs. human + ZIKV genomes. Each data point (mean ± SEM) represents results from HMDMs derived from different human donors. All categories were compared using ANOVA with correction for multiple comparisons. (C) PCA biplot of the first two principal component dimensions comparing RNA-seq of FACS-isolated ZIKV+ or ZIKV− HMDMs from three (12 h and 18 h) or five (mock-infected and 24 h) individual donors. (D) Calculated loss of sensitivity in detecting ZIKV-regulated gene expression. Gene-expression levels were calculated using data from ZIKV+, ZIKV−, and mock-infected macrophage RNA-seq experiments 24 h PI performed with macrophages from five different donors. (E and F) Individual gene expression calculated by RNA-seq in pure populations of mock-infected, ZIKV+, and ZIKV− macrophages (24 h PI). Mean (± SEM) IL1A (E) and CCR1 (F) expressions of pure populations (black bars) were calculated based on RNA-seq from five different donors. Mean (± SEM) expression of a 36% mixed population (white bar) was calculated computationally based on mixing 36% ZIKV+ macrophages with 64% ZIKV− macrophages from each of those five independent RNA-seq experiments. (G) Calculated number of genes expected to be falsely attributed to ZIKV-dependent regulation based on percent infectivity. Calculations were performed as in D. (H) Mean (± SEM) EIF2AK2 and IL6 expression of pure populations (black bars) and a 36% mixed population (white bar) calculated as described in E and F.

