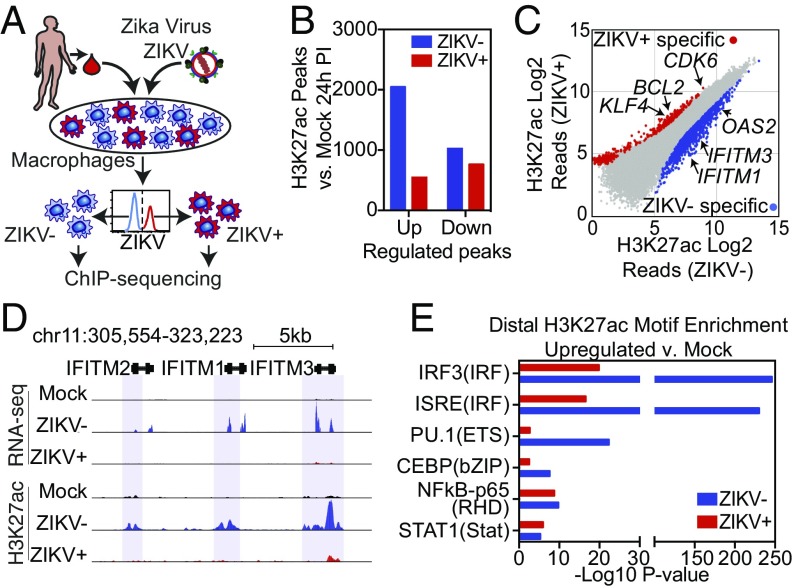
Fig. 3.
ZIKV suppresses the activation of genomic regions containing ISRE/IRF motifs. (A) Diagram depicting the infection model for H3K27ac ChIP-seq. HMDMs are infected with ZIKV and stained for ZIKV group antigen followed by FACS isolation of productively infected ZIKV+ and bystander (ZIKV−) macrophages and then followed by H3K27ac ChIP-seq. (B) The number of regions with significantly increased or decreased H3K27ac (fold change >2 and FDR < 0.01) in ZIKV+ or ZIKV− cells compared with mock-infected cells. (C) Scatter plot of H3K27ac tag counts at genomic regions marked by significant H3K27ac in ZIKV+ vs. ZIKV− macrophages 24 h PI. Regions with significantly elevated levels of H3K27ac in ZIKV+ (red) and ZIKV− (blue) are colored. (D) UCSC browser visualization of H3K27ac near the IFITM gene locus in control, ZIKV+, and ZIKV− cells. The upper panel displays transcription as defined by RNA-seq. The lower panel displays H3K27ac abundance in control (Mock, black), ZIKV− (blue), or ZIKV+ (red) macrophages. Regions with significantly up-regulated H3K27ac in ZIKV− cells are marked with blue shading. (E) Comparative motif enrichment at promoter-distal active regulatory regions as defined by H3K27ac in ZIKV− (blue bars) vs. ZIKV+ (red bars) HMDMs.

