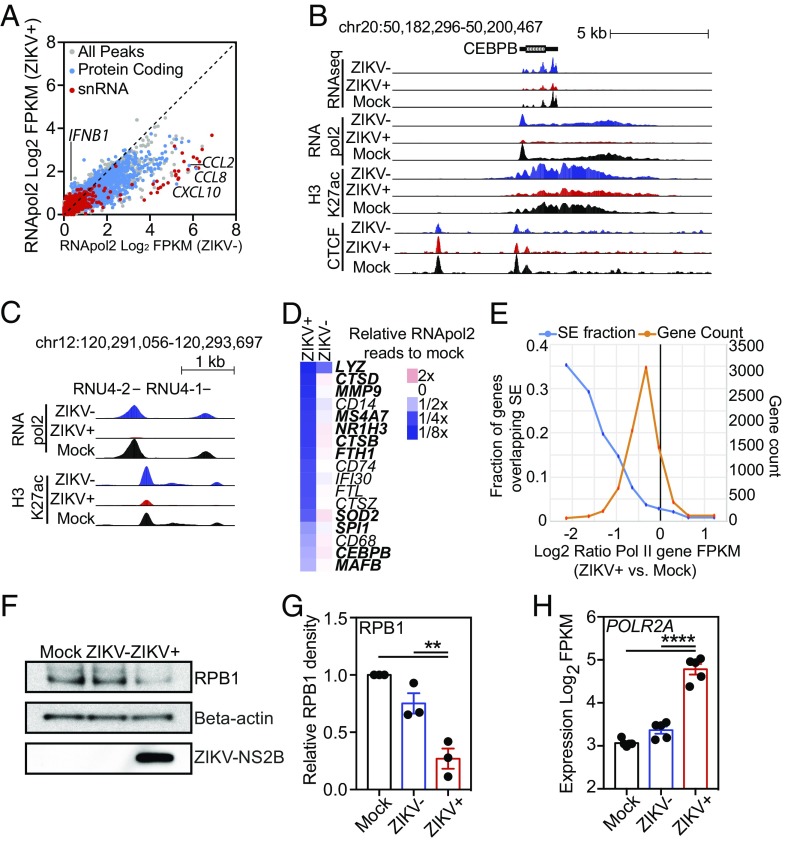
Fig. 4.
ZIKV suppresses RNApol2 recruitment. (A) Scatter plot of log2 FPKM RNApol2 tag counts at genomic regions marked by significant RNApol2 in ZIKV+ vs. ZIKV− macrophages at 24 h PI. Color coding: gray, all genomic regions; blue, protein-coding regions; red, snRNA-coding regions. (B) UCSC browser visualization of RNA-seq (first panel), RNApol2 (second panel), H3K27ac (third panel), and CTCF (fourth panel) near the CEBPB gene locus in control (Mock, black), ZIKV− (blue), or ZIKV+ (red) macrophages. (C) UCSC browser visualization of RNApol2 (Upper) and H3K27ac (Lower) near two snRNA genes, RNU4-2 and RNU4-1, in control (Mock, black), ZIKV− (blue), or ZIKV+ (red) macrophages. (D) Heat map depicting relative RNApol2 levels at core macrophage genes in ZIKV− and ZIKV+ macrophages compared with control macrophages (mock). Genes associated with SEs are shown in bold type. Data are the average from three independent experiments. (E) Relationship between changes in RNApol2 and the presence of SEs. Shown is the log2 ratio of RNApol2 reads at individual genes in ZIKV+ cells compared with control cells (Mock). The orange trace shows the total number of genes associated with each ratio of RNApol2 change. The blue trace shows the fraction of genes overlapping SE as a function of their change in RNApol2. (F) Western blot of RPB1, β-actin, and ZIKV-NS2B levels extracted from FACS-isolated equivalent numbers of mock-infected, ZIKV−, and ZIKV+ cells at 24 h PI. (G) Relative quantitation of Western blot RPB1 levels. RPB1 density is relative to β-actin with control samples set to 1. Relative levels (mean ± SEM) of RPB1 in control (Mock), ZIKV−, and ZIKV+ cells are shown for three infections in different individuals at 24 h PI. (H) Log2-transformed FPKM RNA-seq counts for POLR2A in control (Mock), ZIKV−, and ZIKV+ cells 24 h PI. Data represent expression from RNA-seq performed in five different individuals. Data for G and H were analyzed by ANOVA with all-group comparison with correction for multiple comparisons. Asterisks indicate statistically significant differences (****P < 0.0001; **P < 0.01).

