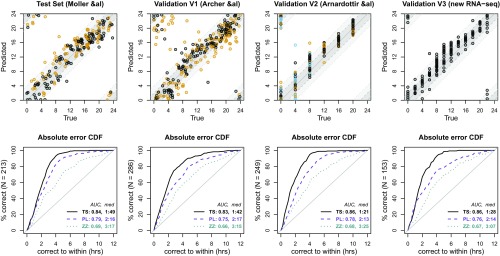
Fig. 1.
Accuracy of TimeSignature predictor applied to data from four distinct studies. Each column corresponds to the indicated dataset. The TimeSignature predictor was trained on a subset of subjects from the Möller–Levet study (37) and then applied to the remaining subjects (Test Set) along with three independent datasets: V1 (38), V2 (39), and V3. For each sample being predicted, two-point within-subject normalization was performed using that sample and a single other sample from the same subject 12 h away. In the top row, the predicted time of day vs. true time of day for each sample is shown. Dark and light gray bands indicate an error range of 2 and 4 about the true time. For the first three studies, color of the point indicates experimental condition: in the Test Set, control (black) vs. sleep restriction (orange); in V1, control (black) vs. forced desynchrony (orange); in V2, control days (black), sleep deprived day (orange), and recovery day (blue). In V3, all subjects () were in the control constant-routine condition (black). In the bottom row, we plot the fraction of correctly predicted samples for each study vs. the size of the error for the TimeSignature predictor (solid black), PLSR-based model (dashed purple), and ZeitZeiger (dotted cyan). Normalized area under the curves (nAUCs) (see Materials and Methods) and median absolute errors are listed for each. The TimeSignature median absolute error across all samples in all studies was 1:37.

