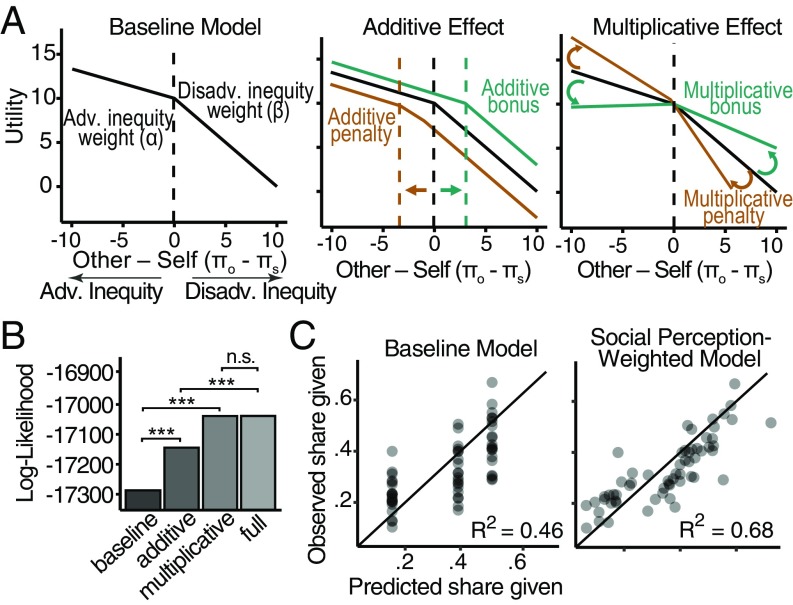
Fig. 2.
Computational decomposition of treatment disparities. (A) Illustration of baseline model and extensions to incorporate social perception information. (A, Left) Baseline model, under the 1:1 exchange rate, where utility is modulated by the extent to which the participant’s payoff is ahead (α) or behind (β) that of the recipient without accounting for social perception. Adv., advantageous; Disadv., disadvantageous. (A, Center) Independent effect where social perception additively affects social valuation. (A, Right) Interacting effect where social perception affects social valuation in a multiplicative manner. (B) Interactive SPW social valuation model significantly outperformed the baseline model and provided the best fit to the data. ***P < 10−10. n.s., not significant. (C) Predictive accuracy of baseline (Left) and SPW (Right) models. Each point indicates the share given to a recipient, for a given each exchange rate, averaged over participants.

