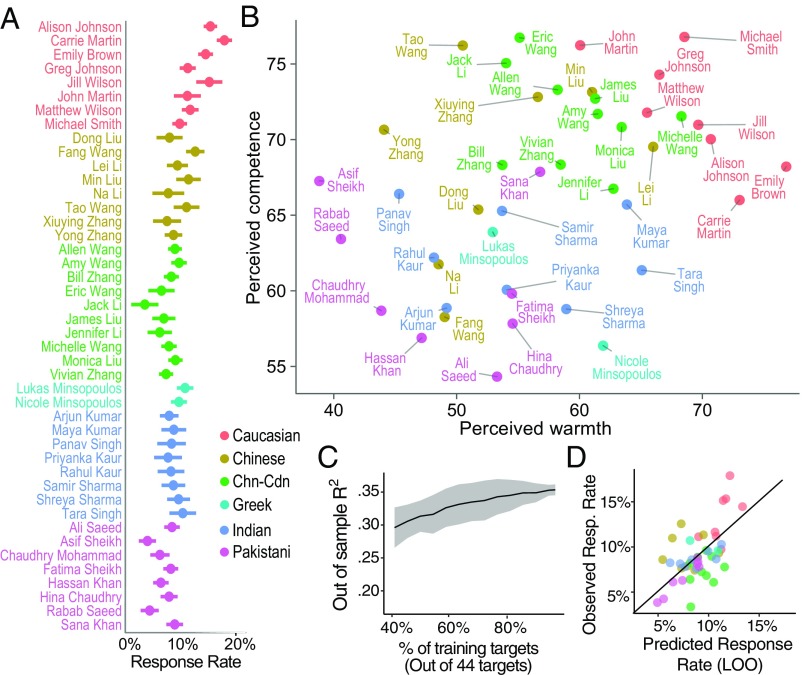
Fig. 5.
Predicting unequal treatment in field data. (A) Response rate variation in Canadian labor market across gender and ethnicity (data from ref. 34.) Each point represents the mean response rate to résumés under a specific name. Chn-Cdn, Chinese-Canadian. (B) Social perception ratings of names in A by an independent sample of participants. (C) Out-of-sample prediction of callback rates at rates significantly greater than chance using training samples of various sizes. Error bands indicate SEM. (D) Accuracy of leave-one-out (LOO) predictions of response rate.

