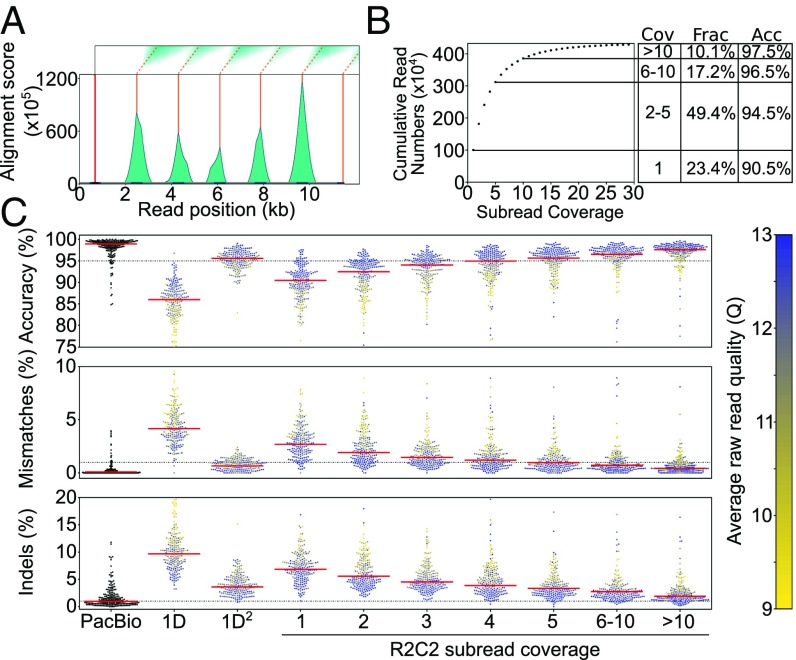
Fig. 2.
Raw reads are processed into consensus reads of varying subread coverage. (A) Example of an 11.5-kb raw ONT read that was analyzed by our custom Smith–Waterman repeat finder. One initial splint (red line) is identified using the BLAT aligner, and then modified Smith–Waterman self-to-self alignments are performed starting from the location of the initial splint. The score matrices (Top) are then processed to generate alignment score histograms (teal). We then call peaks (orange) on these histograms. Complete subreads are then defined as the sequences between two peaks. (B) Cumulative number of SIRV E2 R2C2 consensus reads is plotted against their subread coverage. To the Right, coverage (Cov), fraction of all consensus reads (Frac), and accuracy (Acc) are given for four read bins. (C) PacBio Isoseq, standard ONT 1D, and 1D2 are compared with R2C2 at different subread coverages. Read accuracy is determined by minimap2 alignments to SIRV transcripts (see Methods). Median accuracy is shown as a red line. Accuracy distribution is shown as a swarm plot of 250 randomly subsampled reads. Average raw read quality of ONT reads is indicated by the color of the individual points.

