Fig. 3.
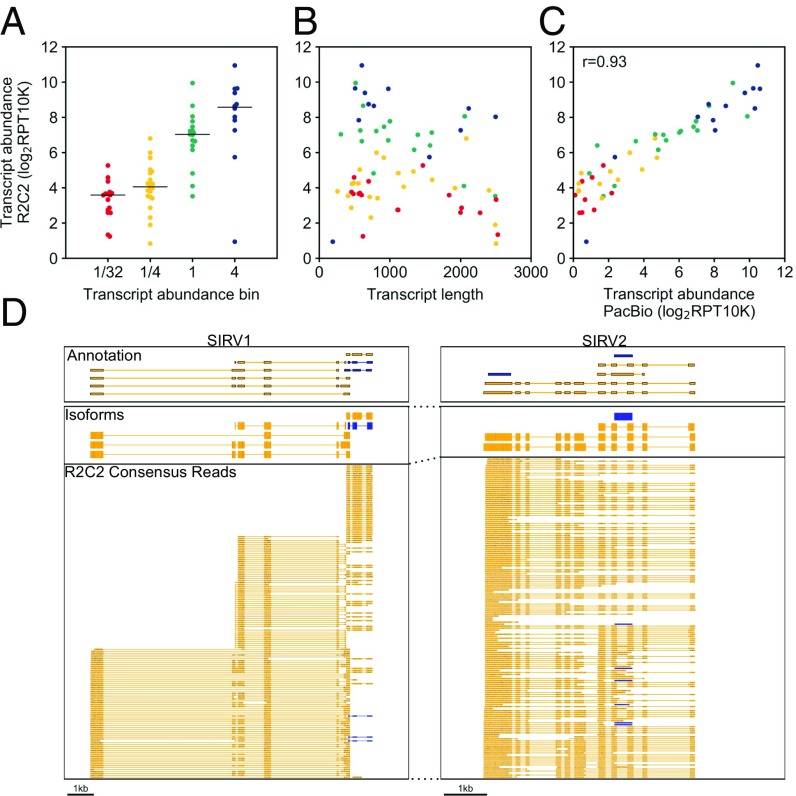
R2C2 reads can quantify SIRV transcripts. R2C2 reads were aligned to SIRV transcripts using minimap2, and expression values’ transcript abundance was determined as Reads Per Transcript Per 10,000 reads (RPT10K). The transcript count ratio was plotted on the y axis against the (A) nominal transcript abundance bin reported by the SIRV transcript manufacturer (Lexogen), (B) transcript length, and (C) transcript count ratio calculated from PacBio Isoseq reads. Pearson correlation coefficient (r) is reported in C. Each point represents a transcript and is colored according to its transcript abundance bin in all panels. (D) Genome browser view of Transcriptome annotation, isoforms identified by Mandalorion, and R2C2 consensus reads is shown of the indicated synthetic SIRV gene loci. Transcript and read direction are shown by colors (blue: +strand; yellow, −strand).

