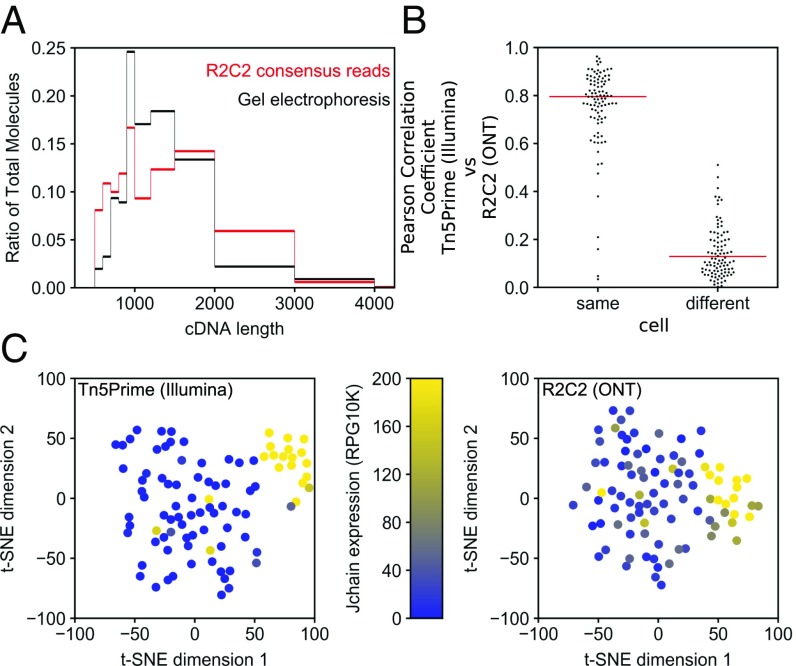
Fig. 4.
R2C2 length bias and gene expression quantification. (A) B cell cDNA molecule length distribution as determined by electrophoresis on 2% agarose gel is compared with R2C2 consensus read length distribution. (B) Pearson correlation coefficient (r) is shown for R2C2 and Illumina-based gene expression quantification of the same or different cells. Red lines indicate medians. All 96 correlation coefficients from same cell comparisons and 96 subsampled correlation coefficients from different cell comparisons are shown as a swarm plot to display their distributions. (C) t-SNE dimensional reduction plots of the same 96 B cells whose transcriptomes were quantified with either the Tn5Prime Illumina-based method or the R2C2 ONT-based method. Cells are colored based on the J chain expression, which is strongly associated with plasmablast cell identity.

