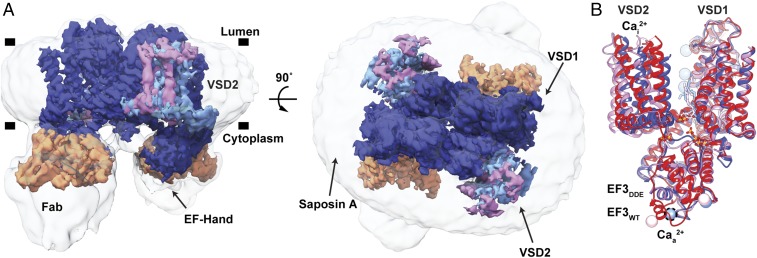
Fig. 1.
Cryo-EM Structure of the AtTPC1DDE–saposin A–Fab complex. (A) Side (Left) and top-down (Right) views of cryo-EM density. The composite map is colored to highlight high-resolution features of TPC1 (blue, EMDB entry no. 8957), VSD2 in state 1 (cyan, EMDB entry no. 8958) and state 2 (pink, EMDB entry no. 8960), and the Fab variable domains (orange, EMDB entry no. 8956). Unsharpened density is shown at low contour (transparent gray). Membrane boundaries (black bars) defined by the nanodisc are marked. (B) Overlay of AtTPC1WT (red, PDB ID code 5DQQ), state 1 (blue), and state 2 (pink). Cai2+ and Caa2+ denote sites of luminal inhibition and cytoplasmic activation by Ca2+ ions. Dash lines around Caa2+ indicate hypothetical position in cryo-EM structure. Ca2+ ions shown as colored balls.

