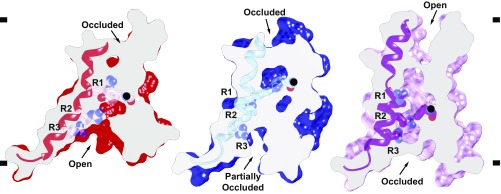
Fig. 3.
Activation of the voltage sensor. Side views of a common slice perpendicular to the membrane surface of VSD2 in AtTPC1WT resting state (red, PDB ID code 5DQQ) and AtTPC1DDE state 1 (blue) and state 2 (pink). S10 shown with gating charges R1–R3. The CT Cα position (black ball) is marked. Based on a structural alignment with respect to the pore helices S6–S7 of each structure.

