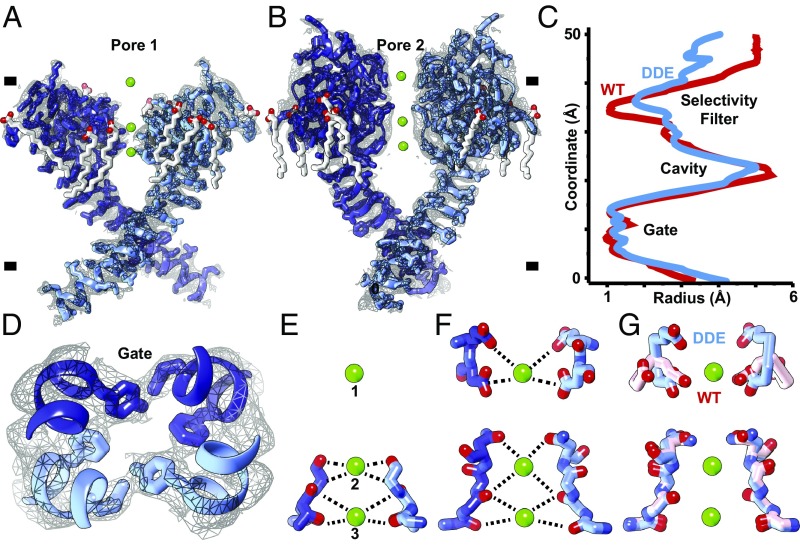
Fig. 4.
Ion permeation pathway. (A and B) Orthogonal side views through pore helices (A) S5–S6 (pore 1) and (B) S11–S12 (pore 2) of the channel homodimer overlaid with high-resolution cryo-EM density (gray mesh). (C) HOLE plot of pore radii along central channel coordinate of AtTPC1DDE (red) and AtTPC1WT (blue). (D) Top-down view through central pore. Gate residues Y305, L673, and F676 are shown. (E–G) Side views through the selectivity filter in (E) pore 1, (F) pore 2, and (G) an overlay of pore 2 of AtTPC1DDE (blue) and AtTPC1WT (pink). (Upper) E605 and D606 and (Lower) S265, T263, T264, V628, M629, and N631 selectivity filter residues are shown. Density for lipids (SI Appendix, Fig. S7) and ions is omitted for clarity.

