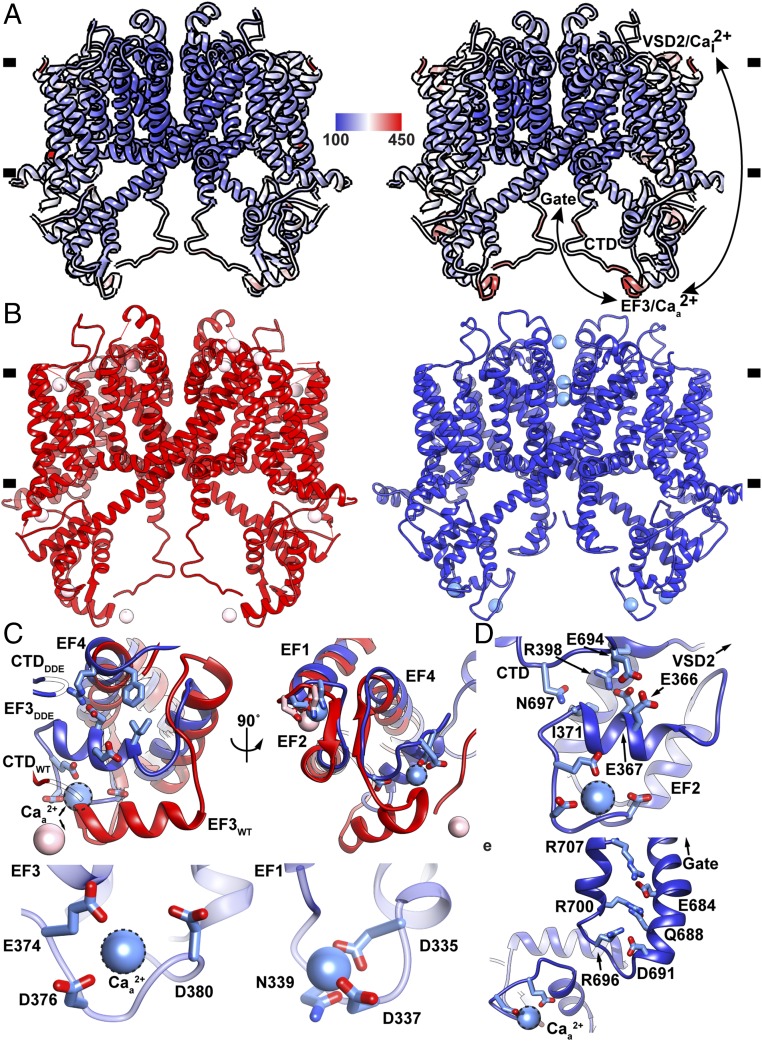
Fig. 5.
Dynamics of cytoplasmic domains. (A) Overlay of (Left) AtTPC1WT and (Right) AtTPC1DA crystal structures colored by B-factor value (100–450 Å2) (see Methods and SI Appendix, Supplementary Discussion). (B) Side views of AtTPC1WT (red) and AtTPC1DDE (blue). (C) Views from (Top Left) side and (Top Right) bottom of EF3 for overlaid AtTPC1DDE (blue) and AtTPC1WT crystal structures (red, PDB ID code 5DQQ). CTD interactions are omitted for clarity. Ca2+-ion binding sites in (Bottom Right) EF1–EF2 and (Bottom Left) EF3–EF4. (D) View of EF3-CTD and EF3-EF4 interactions and connection to VSD2. (E) Structure of the CTD in AtTPC1DDE and a possible coupling pathway to the pore gate and Caa2+. Dashed lines indicate the hypothetical Caa2+ ion position.

