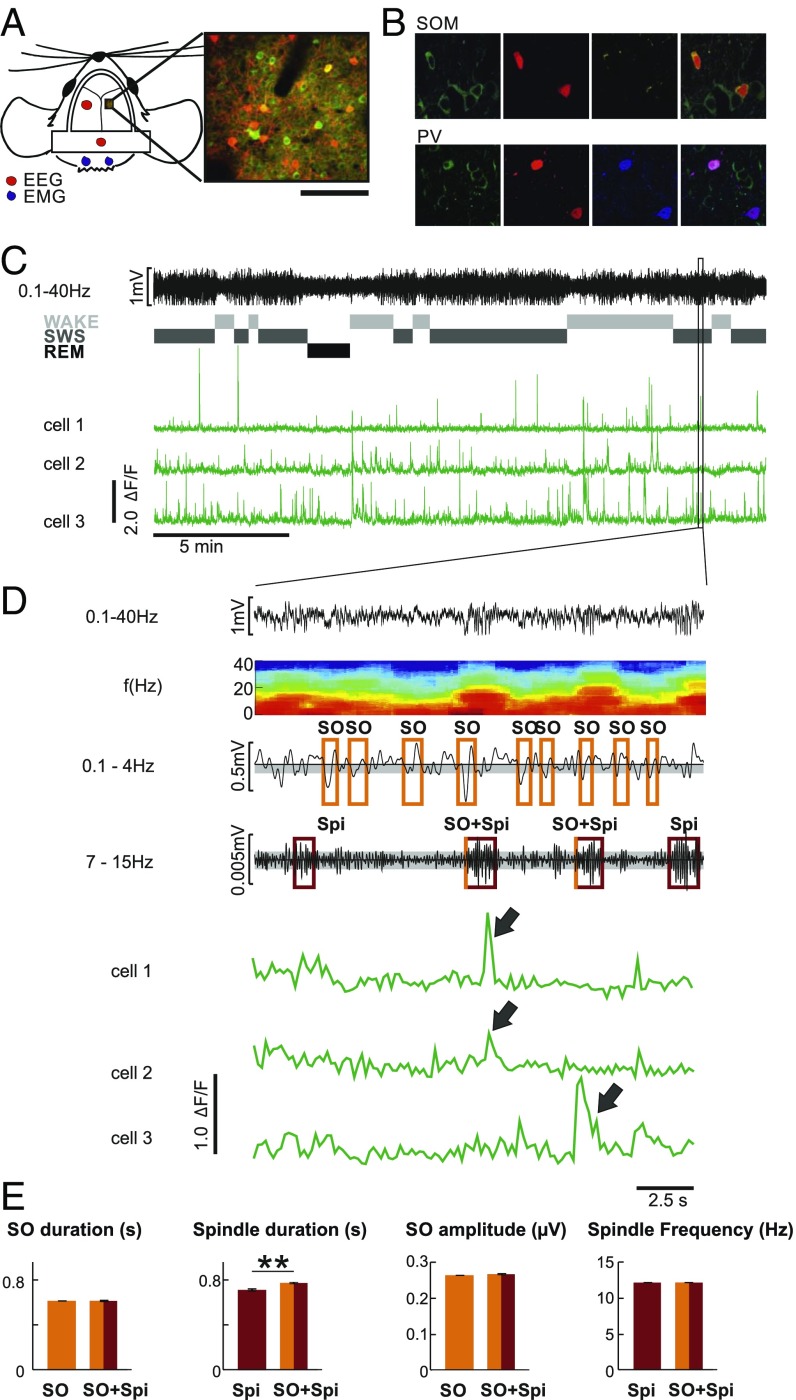
Fig. 1.
Simultaneous EEG recording and two-photon calcium imaging. (A, Left) Illustration of EEG and electromyography (EMG) electrode positions and of the imaging window for the two-photon experiments. (A, Right) Example frame from one SOM-Cre animal. (Scale bar: 100 μm.) (B) Fluorescence image of GCaMP6f (green) and td-tomato–positive interneurons (red; Top, SOM-Cre; Bottom, PV-Cre) and immunohistochemical staining (yellow, SOM; blue, PV). (C) Example EEG trace (from a parietal electrode) and, underneath, corresponding classification of sleep stages [wake, SWS, rapid eye movement (REM) sleep] and example calcium activity traces from three individual putative Pyr cells. The frame marks the interval magnified in D. (D, Top) Zoomed-in EEG trace (from a parietal electrode) and, underneath, the corresponding time-frequency plot. For detection of slow oscillation(s) (SO), the EEG signal was filtered between 0.1 and 4.0 Hz. An SO was identified in the EEG when (i) the distance between consecutive positive-to-negative zero crossings was between 0.4 and 2 s, (ii) the amplitude of the negative half-wave peak in this interval exceeded 0.66 SD (gray-shaded range) from the mean of all identified intervals in a recording session, and (iii) the difference in amplitude between the negative and succeeding positive peak was greater than 2/3 of the average negative-to-positive peak amplitude for all identified intervals in a recording session. Spindle(s) (Spi) were detected when the amplitude of the filtered EEG signal (7–15 Hz) was greater than 1.5 SDs from the mean (gray-shaded range) amplitude during a recording session for at least 0.5 s. (D, Bottom) Example fluorescence traces (ΔF/F) from three individual putative Pyr cells during the same time interval. Note the synchronous activity of cells 1 and 2 during the first Spi co-occurring with an SO and of cell 3 during the second Spi co-occurring with an SO (arrows). (E) Summary of SO and Spi properties (mean duration, mean SO amplitude, mean Spi frequency across all animals and all recorded events), separately for isolated SO and Spi and for SO co-occurring with Spi (SO + Spi). **P < 0.01, for pairwise comparison (corresponding results for each animal are shown in SI Appendix, Table S1).

